

We just launched a new app for you to download from the Application Library update. This app is a dedicated tool for modeling the flow and pressure distribution inside a network of connected pipes. Engineers in semiconductor processing could use a tool like this to test a given design and ensure it will meet specification before prototyping the physical device. Here, I’ll give you some background info and walk you through how this app works.
Background Information
A gas box is used to feed in mixtures of chemicals in specific ratios into a process chamber. Once inside the process chamber, these gases react to allow thin films to be deposited on the surface of a wafer. These films can be grown in a controlled manner, allowing for the manufacturing of semiconducting computer chips. The gas box can be considered an essential piece of the semiconductor manufacturing process.
The ratio and magnitude of each of the chemicals fed into the process chamber is controlled by a mass flow controller (MFC). Each MFC supplies a given flow rate to each of the pipes in a network and can only function correctly if the back pressure in the pipe network remains below 760 Torr. The back pressure is defined as the maximum pressure in the pipe network. This application computes the back pressure in a network of pipes fed by a system of mass flow controllers.
The Pipe Flow Module is used to compute the pressure distribution inside the pipe network and report whether a given design will meet the back pressure specification. The first row in the “Mass flow controller properties” table (shown in the screenshot a bit further down) corresponds to the pipe farthest to the right in the default plot (the bottom pipe in the sketch below).
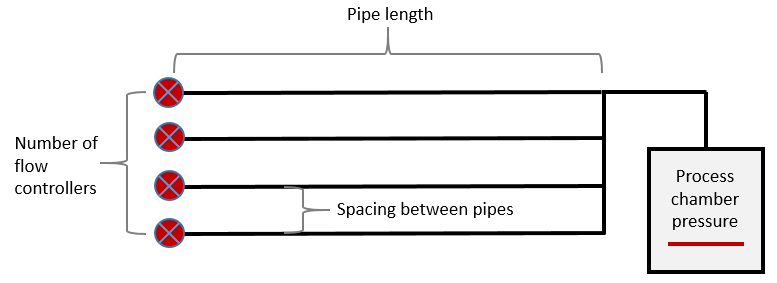
The back pressure in the network increases if:
- The Pipe length is increased.
- The Pipe diameter is decreased.
- The Temperature is increased.
- The Process chamber pressure is increased.
- The Spacing between pipes is increased.
The back pressure generated across a single pipe can be estimated using the Hagen-Poiseuille equation:
where the left-hand side is the pressure drop, \mu is the dynamic viscosity, L is the pipe length, Q is the flow rate, and d is the pipe diameter.
So, the pressure drop will scale linearly with the pipe length and flow rate, but to the fourth power of the inverse of the pipe diameter. In other words, small changes to the pipe diameter can significantly change the back pressure. Once the pipes become connected in a network, a more sophisticated approach is required. COMSOL Multiphysics simulation software solves a one-dimensional form of the Navier-Stokes equations to accurately predict the back pressure in a system of connected pipes.
Running the Flow Control Application
When you run the application, there are options to change the pipe length, pipe diameter, the number of flow controllers, etc. If any of the input parameters are changed, the Information section warns you that the current solution is not consistent with the input parameters. The report generation is disabled until the solution is computed again.
If the number of flow controllers is changed by adding or removing rows in the table, the geometry is automatically re-generated and displayed in the graphics window. Upon computing the solution, the back pressure is reported in the Results section and the Information section displays whether the specific design will meet the specification or not.
")
Screenshot of the app in action.
Creating the Application
This application is constructed by adding the following components in the COMSOL Multiphysics Application Builder:
- Menu
- The menu is used to save or exit the application
- Ribbon
- The ribbon is used to execute certain actions such as resetting the user input and computing the solution
- A collection of Forms
- The forms give the application its look and feel
- Events
- Events are used to trigger a warning in the Information section when the data in the table is modified
- Declarations
- Declarations store data internal to the application
- A set of Methods
- Methods perform actions that can’t be attached directly to form components
- A Library of images
- This is used to decorate the ribbon and provide a nicer look and feel for the application
")
Annotated screenshot showing the different components of the application.
Form Editor
The Form Editor is used to give the look and feel of the application. This is done by laying out form components on a number of different forms. These forms are then integrated into a main form, which is shown when you run the application. A grid-based layout is used for each form, which ensures that the application will look the same on different platforms.
")
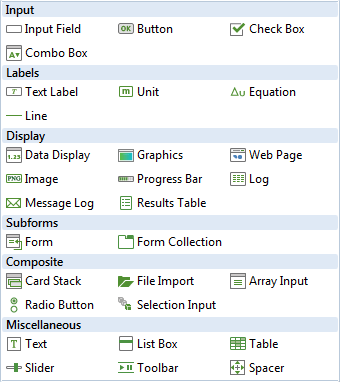
Form Components
The user interface for an application consists of a collection of form components.
My app has the following form components:
- Text Labels to describe which input should be entered.
- Input Fields for the pipe length, pipe diameter, etc.
- Units, which are associated with each of the input fields.
- A Combo Box to indicate which friction model is used.
- A Table to specify the flow rates, molecular weights, and dynamic viscosity for each flow controller.
- Lines to separate the Input, Results, and Information sections.
- An Equation to describe the analytic pressure drop in a pipe.
- Data Display to indicate the value of the back pressure.
- Images to decorate the ribbon, update the Information section, and show the COMSOL Multiphysics logo.
- Graphics to plot the pressure and velocity in the pipe network.
- A Card Stack to update the Information section depending on the current status of the application.
- A Form Collection to provide tabbed graphics windows for the pressure and velocity plots.
Card Stacks
Card stacks provide a simple way to show different text or images when a certain event occurs. The source for the active card is a String declaration called information_card. When the value of this string changes, the card displayed in the application is updated. The Information section of this application contains a card stack with four different cards.
One card each for:
- Displaying that the current design meets the specification.
- Displaying that the current design does not meet the specification.
- Indicating that no solution exists. This is the default card and is shown when the application is first launched.
- Displaying that the input data has changed since the solution was computed.
The individual cards can be accessed from the Card Stack in the Form Editor by holding down the Alt key and left-clicking.
")
Screenshot showing the status of the app if the back pressure exceeds the maximum value.
The Ribbon
The ribbon provides a convenient way of adding buttons that can trigger events to the Main Window. In the application that I created, each ribbon item executes a method when clicked.
There are four ribbon items in my app:
- Reset to Default Values
- Clicking this item causes the input parameters to be reset to their default values
- Compute
- This calls a method, which solves the problem, updates the plots, and computes the back pressure
- About
- This launches a PDF document containing information about the operating principle and limitations of the application
- Create Report
- This calls a method that generates a Microsoft® Word® document for the current state of the application.
For each ribbon item, it is possible to execute various commands to run, like computing the solution, updating the geometry, opening dialog boxes, and so forth. It is also possible to call any number of methods.
")
Screenshot showing how items can be added to a ribbon in the Main Window.
Data Change Events
If any of the input data is changed before the solution has been re-computed, it is useful to make the app user aware of this. The card shown in the card stack is updated when any of the inputs are changed. This is done by writing a Local method for each of the input edit fields. The method is extremely simple, consisting of only one line of code:
information_card = "warningnewinput";
This swaps the image shown in the Information section for a warning message.
")
Screenshot showing the status of the application when the inputs have changed (the warning is in the bottom-left corner).
Methods
There are six methods defined in the application. The methods and the tasks they are designed to accomplish are as follows:
- b_reset_input_to_defaults
- This method resets all the user input to the default values and rebuilds the geometry.
- b_solve_and_update
- This is the main method and is executed when clicking the Compute button. For each flow controller in the table, an inlet feature is applied and the appropriate flow rate is specified. The material properties in each leg of the pipe network are also set. The solution is then computed and the graphics windows updated with the new plots. Finally, the maximum pressure is computed, and the Information section is updated to reflect whether the given design will meet the specification.
- b_open_doc
- This opens the PDF document explaining the operating principle of the gas box.
- b_report_generation
- This method generates the report that summarizes the inputs and outputs in a Microsoft® Word® document.
- data_change
- This method updates the geometry if the number of flow controllers changes and shows a warning in the Information section explaining that the current solution is inconsistent with the inputs.
- update_geometry
- This method updates the geometry and plots it in the graphics window.
Methods are extremely powerful in that they allow you to manipulate the model and application in a very flexible way. The method b_solve_and_update adds an inlet feature to the model for each mass flow controller and sets the flow properties based on the data in the table. It then sets the density and viscosity of the fluid in each of the pipes, also based on the data specified in the Flow controller and fluid properties table. Following this, the solution is computed and the plots are updated. Finally, the maximum back pressure is computed and the information card indicating whether this specific configuration will meet the specification is updated.
")
Screenshot of the solve_and_compute method when viewed in the Method Editor.
Report Generation
A sample report from the default input parameters can be found here: gas_box.
Next Steps
- Download the Gas Box Application tutorial via the Application Library update or from the Model Gallery


Comments (2)
雷 馬
June 30, 2020how can i download this Gas Box application?
雷 馬
June 30, 2020if the download is possible, please send the link to the following mail-address,
marlen730@gmail.com