

Today, guest blogger and Certified Consultant Nagi Elabbasi of Veryst Engineering shares simulation research designed to optimize band gaps for phononic crystals.
Phononic crystals are rather unique materials that can be engineered with a particular band gap. As the demand for these materials continues to grow, so does the interest in simulating them, specifically to optimize their band gaps. COMSOL Multiphysics, as we’ll show you here, can be used to perform such studies.
What Is a Phononic Crystal?
A phononic crystal is an artificially manufactured structure, or material, with periodic constitutive or geometric properties that are designed to influence the characteristics of mechanical wave propagation. When engineering these crystals, it is possible to isolate vibration within a certain frequency range. Vibration within this selected frequency range, referred to as the band gap, is attenuated by a mechanism of wave interferences within the periodic system. Such behavior is similar to that of a more widely known nanostructure that is used in semiconductor applications: a photonic crystal.
Optimizing the band gap of a phononic crystal can be challenging. We at Veryst Engineering have found COMSOL Multiphysics to be a valuable tool in helping to address such difficulties.
Setting Up a Phononic Band Gap Analysis
When it comes to creating a band gap in a periodic structure, one way to do so is to use a unit cell composed of a stiff inner core and a softer outer matrix material. This configuration is shown in the figure below.
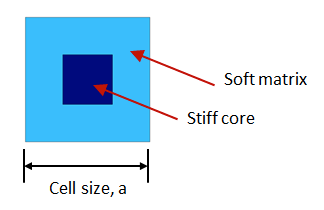
A schematic of a unit cell. The cell is composed of a stiff core material and a softer outer matrix material.
Evaluating the frequency response of a phononic crystal simply requires an analysis of the periodic unit cell, with Bloch periodic boundary conditions spanning a range of wave vectors. It is sufficient to span a relatively small range of wave vectors covering the edges of the so-called irreducible Brillouin zone (IBZ). For rectangular 2D structures, the IBZ (shown below) spans from Γ to X to M and then back to Γ.
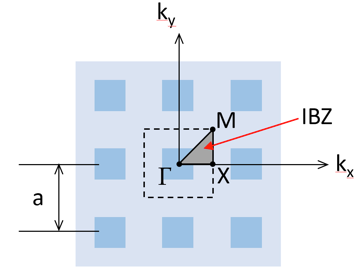
The irreducible Brillouin zone for 2D square periodic structures.
The Bloch boundary conditions (known as the Floquet boundary conditions in 1D), which constrain the boundary displacements of the periodic structure, are as follows:
where kF is the wave vector.
The source and destination are applied once to the left and right edges of the unit cell and once to the top and bottom edges. This type of boundary condition is available in COMSOL Multiphysics. Due to the nature of the boundary conditions, a complex eigensolver is needed. The system of equations, however, is Hermitian. As such, the resulting eigenvalues are real, assuming that no damping is incorporated into the model. The COMSOL software makes this step rather easy, as it automatically handles the calculation.
We set up our eigensolver analysis as a parametric sweep involving one parameter, k, which varies from 0 to 3. Here, 0 to 1 defines a wave number spanning the Γ-X edge, 1 to 2 defines a wave number spanning the X-M edge, and 2 to 3 defines a wave number spanning the diagonal M-Γ edge of the IBZ. For each parameter, we solve for the lowest natural frequencies. We then plot the wave propagation frequencies at each value of k. A band gap appears in the plot as a region in which no wave propagation branches exist. Aside from very complex unit cell models, completing the analysis takes just a few minutes. We can therefore conclude that this approach is an efficient technique for optimization if you are targeting a certain band gap location or if you want to maximize band gap width.
Performing the Optimization Studies
To illustrate such an application, we model the periodic structure shown above, with a unit cell size of 1 cm × 1 cm and a core material size of 4 mm × 4 mm. The matrix material features a modulus of 2 GPa and a density of 1000 kg/m3. The core material, meanwhile, has a modulus of 200 GPa and a density of 8000 kg/m3. The figure below shows no wave propagation frequencies in the range of 60 to 72 kHz.
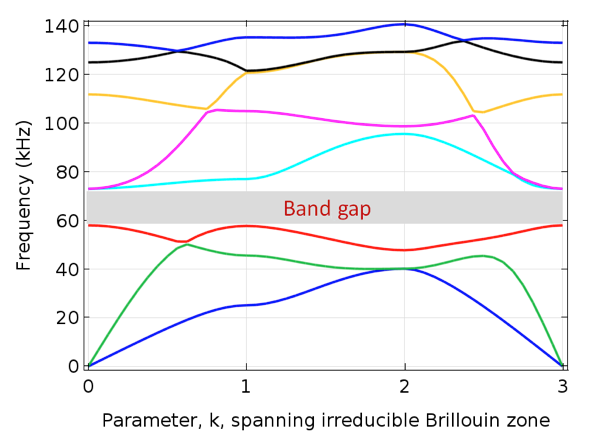
The frequency band diagram for selected unit cell parameters.
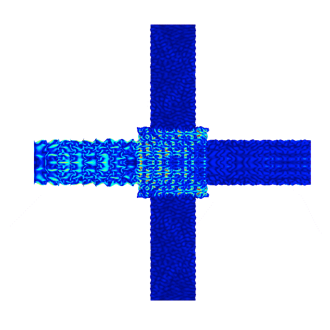
To demonstrate the use of the band gap concept for vibration isolation, we simulate a structure consisting of 11 x 11 cells from the periodic structure analyzed above. These cells are subjected to an excitation frequency of 67.5 kHz (in the band gap).
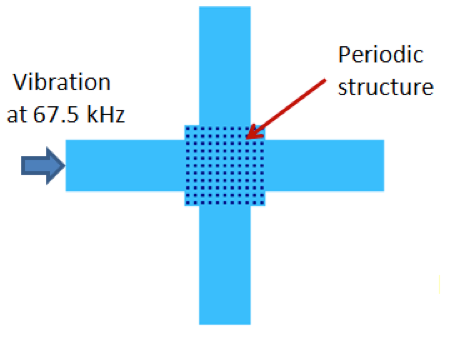
The structure used to illustrate vibration isolation for an applied frequency in the band gap.
The animation below highlights the response of the cells. From the results, we can gather how effective the periodic structure is at isolating the rest of the structure from the applied vibrations. The vibration isolation is still practically efficient, even if fewer periodic cells are used.
An animation of the vibration response at 67.5 kHz.
Note that at frequencies outside of the band gap, the periodic structure does not isolate the vibrations. These responses are depicted in the figures below.
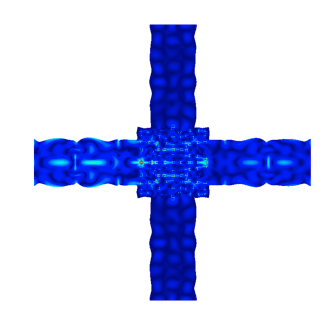
The vibration response at frequencies outside of the band gap. Left: 27 kHz. Right: 88 kHz.
Try It Yourself
Download the 2D phononic band gap model via the Application Exchange.
References
- P. Deymier (Editor), Acoustic Metamaterials and Phononic Crystals, Springer, 2013.
- M. Hussein, M. Leamy, and M. Ruzzene, Dynamics of Phononic Materials and Structures: Historical Origins, Recent Progress, and Future Outlook, Appl. Mech. Rev 66(4), 2014.
About the Guest Author
Nagi Elabbasi, PhD, is a managing engineer at Veryst Engineering LLC. Nagi’s primary area of expertise is the modeling and simulation of multiphysics systems. He has extensive experience in the finite element modeling of structural, CFD, heat transfer, and coupled systems, including fluid-structure interaction, conjugate heat transfer, and structural-acoustic coupling. Veryst Engineering provides services in product development, failure analysis, and material testing and modeling, and is a COMSOL Certified Consultant.

Comments (70)
Ahmed Nagaty
March 22, 2016how can i calculate the transmission of a structure of 2D phononic crystal ???
Nagi Elabbasi
March 29, 2016If you model an array of the phononic structure you can evaluate the average pressure at the outlet and at the inlet and use that to calculate the transmission loss or transmission spectrum. There is a COMSOL model in the Application Gallery that you can download which shows how to set that up. It’s called Sonic Crystal, Application ID 16925. The model is a little different from the one in this Blog but the concept is the same.
Andrea Oñate
May 2, 2021Dear Nagi,
I am currently working with your model, but I have a problem when I try to use a hyperelastic material. I think the problem is related to including geometric nonlinearities, but I have not been able to solve it. I would be very grateful for some advice on this.
Theodore Martin
April 8, 2016Ok, but there is a known issue with solving the eigenvalues in COMSOL when you have complex material properties (i.e. with loss). The solver outputs frequencies for a given k-vector, the traditional way to solve the problem is to input frequency and output the complex k-vector, which can be used to calculate the effective medium properties of the crystal. In a real measurement you know the frequency, not the k-vector. Does your example account for loss in this way?
Nagi Elabbasi
April 8, 2016Theodore, I never tried the approach you mentioned where we input frequency and solve for the k-vector. It is very useful but the resulting eigenvalue problems are not directly “ready” for implementation in FEA codes. COMSOL is as flexible as it gets for a commercial FEA code so it is probably doable in COMSOL. The case I modeled here where the k-vector is set/spanned and we solve for the frequencies is more straightforward to implement. Also in my examples there is no complex material properties (to account for loss/damping). The complex formulation just results from the Bloch boundary conditions.
Zhaoxuan Zhang
April 12, 2016Hello Nagi. I wanna know whether your model is to analyse XY mode or Zmode or both modes?
Nagi Elabbasi
April 12, 2016Hi Zhaoxuan,
The model and results shown here are all for modes and deformation in the X-Y plane (plane of the phononic structure). A very similar model can probably be used to analyze Z direction modes by using plate elements instead of 2D planar elements.
Zhaoxuan Zhang
April 13, 2016Hi, Nagi,
Thanks a lot for your reply. Do you mind share a simple model for Z mode calculation?
Nagi Elabbasi
April 13, 2016Unfortunately, I don’t have time to work on that Zhaoxuan. If you try it out yourself and face a problem that may be easier for me to help with.
Zhaoxuan Zhang
April 13, 2016Thank you, Nagi. You really helped me a lot.
You mentioned using plate elements to analyze Z mode, do you mean I should select ‘plate’ instead of ‘solid mechanics’ from ‘structural mechanics’ list in ‘select physics’ window? If so, I cannot find where to add periodic condition.
Nagi Elabbasi
April 14, 2016Hi Zhaoxuan, you are right there is no option for periodic boundary conditions in the plate (or shell) physics. You can still however implement it manually using Boundary Similarity between the two sides, and manually applying the Floquet boundary condition. That’s actually how we did it way back in an older COMSOL Multiphysics version, many years back, before they added the Periodic Boundary condition.
Zhuhua Tan
May 19, 2016Hi Nagi, Thank you for your further analysis on the vibration response at frequencies outside of the band gap. Could you upload the further analysis file?
Zhuhua Tan
May 20, 2016Hi Nagi, the model is the best example for the beginner of Comsol. During analysis “The frequency band diagram for selected unit cell parameters”, how did you apply the 67.5kHz and 88 kHz excitation and what is the boundary? Thank you very much!
Zhaoxuan Zhang
May 22, 2016Hi Nagi! Thanks for your guidance. I’ve successfully made Z mode calculation. Now I’m working on fluid-solid phoninic crystal. I’m not sure which physics I should use. Could you give me some suggestions?
Nagi Elabbasi
May 22, 2016Hi Zhuhua, I cannot share the full structural model you are referring to from the Blog. However, it’s a standard solid mechanics physics with a harmonic frequency response analysis. You apply a pressure boundary condition on one end of the structure and specify which frequencies to solve at in the solver settings. You will find several COMSOL Application examples to get you started including this one: https://www.comsol.com/model/bracket-transient-analysis-10314. I hope this helps.
Nagi Elabbasi
May 22, 2016Hi Zhaoxuan, that’s great! For the fluid-solid phononic crystal you need to add a frequency domain fluid physics. If fluid damping is not important I recommend using pressure acoustics physics. If not then check out one of the advanced acoustics formulations like the Linearized Navier Stokes physics.
Zhuhua Tan
May 24, 2016Hi Nagi, thank you for your kind help and advice. Apply a force boudary ( choose pressure option?). And I have one more question. Did you add any other boudary condition on the phononic crystals part in the model in this blog? Thank you!
Lyun Yang
May 29, 2016Hi Nagi,you mentioned to optimize the band gaps above and I want to do it using a topology optimization method in comsol, but I just dont know how to start.
(go to this site to get more mathematical details http://rsta.royalsocietypublishing.org/content/361/1806/1001)
I wonder if you can give me any advices, especially on how to use the Optimization Module?
best regards!
Nagi Elabbasi
May 30, 2016Hi Lyun,
I would start by going through one or two practice examples from the Optimization Module assuming you know the theory behind topology optimization well enough. As a topology optimization problem I believe this will be quite an easy one given the constraint of periodicity, and number of materials.
You may need to use MATLAB or Java as well since I cannot think right now of a way to calculate the width of the band-gap strictly within COMSOL Multiphysics.
Ahmed Mohamed
October 15, 2016hi …please if i have a phononic crystal composed of water square impeded in a PZT-5H matrix, and i want to calculate the band structure and transmission for it ..what modules can i use it to calculate it??
Nagi Elabbasi
October 17, 2016Dear Ahmed, you need an acoustic-structure interaction model with a piezoelectric solid material. The pressure acoustics formulation is most likely accurate enough to represent the water. The Acoustics Module should be sufficient.
siti kamarunnor
October 30, 2016Hai Nagi Elabbasi,
I followed this post since early January and I try to build this band gap myself using comsol 5.0 but until now I still clueless what type of module that I suppose workout. I already try using acoustic-acoustic solid interaction and I also used acoustic-elastic wave. Can you help me which module I suppose used and compare to photonic band gap, where suppose I change in order to get phononic bad gap as shown in your blog. I hope you can help me.
Thank you
siti kamarunnor
October 30, 2016Hai Nagi Elabbasi,
I have been followed up your post since early January and try to build myself using Comsol 5.0, but I still clueless what type of model that I suppose used in order to build phononic band gap. Before this, I try used acoustic-solid interaction and elastic wave but I still don’t get where I suppose change from module photonic band gap to get phononic band gap. I hope you can explain a little bit because my final year project is about phononic band gap.
Nagi Elabbasi
October 30, 2016Dear Siti,
The Floquet periodic boundary condition for solids is available, according to COMSOL product specification chart, in the Acoustics, MEMS, and Structural Mechanics Modules. That is the key to the phononic band gap analysis. I hope the model I uploaded to the COMSOL Exchange and the other COMSOL models that show photonic band gaps help you solve your problem.
Guillermo Arregui Bravo
December 19, 2016Dear Nagi Elabbasi,
I was wondering if the study could be done identifying the bands, since here we do not have anything to identify to which band the specific point of the band diagram belongs to. Knowing the bands (a priori, since we could also think about doing some post process to try to retrieve band number) can help with DOS calculation.
I know that the Photonic Band Gap tutorial does it, but it is applied to a dispersive material and it is pretty obtuse as a tutorial, so I do not understand how to adapt it to non-dispersive media (in some other way that the direct one of just setting n(w)=ctt). Do you have some advice or some other way of getting band index?
Thank you very much in advance
Nagi Elabbasi
December 25, 2016Dear Guillermo,
I don’t know of a way to automatically identify the band number for a specific point. The approach used in the photonic band gap example you mentioned can conceptually (probably) be used. However, there is no similar predefined structural analysis physics like the one used in that example (electromagnetic waves, frequency domain) where the frequency dependent term is included in a stationary analysis.
Here is an idea that may work, though I never tried it. If you are using MATLAB or Java with COMSOL you can define products of mode shapes in a way that exploits the fact that mode shapes of the same band number are very similar for close values of the wave vector “k”.
Clarence M. Wells
January 1, 2017Dear Nagi Elabbasi,
for calculating the band structure of phononic crystals, i have some questions
1- when one of the materials is fluid ( sometimes both ) what physics should i applied?
2- the band structure u calculated here is for a unit cell of a phononic crystals without defects, if i wanna compute the band structure of a phononic crystal with a line defect ( a waveguide ) what should i do ? how can i define a supercell ?
3- how can i calculate transmission ?
Thank you very much in advance
Nagi Elabbasi
January 1, 2017Dear Clarence, see my responses below:
1. See my comment earlier in this post about phononic crystals involving fluids and solids – you need structural-acoustics physics or a more accurate fluid approximation such as the Linearized Navier Stokes, or Thermo-viscous Acoustics.
2. You can probably define a supercell but I haven’t tried it. i tried to upload a figure for a crude wave guide model, used for illustration, where we modeled the full structure. However, there doesn’t seem to be a way to upload figures here.
3. See the second comment in this post for a good COMSOL Application model showing the calculation of the transmission.
Regards,
Nagi
Clarence M. Wells
January 2, 2017Dear Nagi Elabbasi
tnx a lot for your responses
i have a question about the sweep of kx and ky, why u sweep these in this why?
can u explain this for me?
i cant understand why u sweep these in this way?
Cecilia Casarini
January 19, 2017Dear Nagi,
Your example was really useful. I am now trying to calculate the band structure when the unit is an air cylinder (like a soft drink can). Since the resonant frequency of the cylinder will influence the band gap and given that the height of the cylinder influences its resonant frequency, my question is: is it possible to replicate your model having as unit a cylinder? Is it possible to apply Floquet condition to it?
Thank you in advance,
Cecilia
Nagi Elabbasi
January 19, 2017Dear Clarence, I sweep this way to cover the 3 sides of the irreducible Brillouin zone in one simulation; one side from k=0 to 1, the second from 1 to 2, and the third from 2 to 3.
Nagi Elabbasi
January 19, 2017Thanks Cecilia. I don’t fully understand your model, but the periodic unit cannot be cylindrical. Depending on how the cylinders are packed the periodic unit can be a square or a hexagon, and you can apply the Floquet condition to it. You need a 3D model it seems, and that is doable as well. I hope this helps. Nagi
Jian Zhou
January 23, 2017Dear Nagi,
In your model, the irreducible Brillouin zone (Γ-X edge, 1 to 2 defines a wave number spanning the X-M edge, and 2 to 3 defines a wave number spanning the diagonal M-Γ edge), the Γ-X edge and M-Γ edge have a different distance, I think whether 1 to 2 and 2 to 3 is reasonable or not. I want to simulate the band gap in the full zone(Γ-X-M-Γ), and the length of M-Γ should be larger than Γ-X in the bandgap diagram. Please give me some advice.
Best!
Jian
Clarence M. Wells
January 24, 2017Dear Nagi Elabbasi
in this example, you did a simulation of excitation elastic waves
to excite elastic waves, which physique did you use?
i tried to excite elastic waves by using ” elastic waves physique ” and in this physique, i use ” boundary load ” but i think it did not work in a correct way
truly..
Nagi Elabbasi
January 25, 2017Dear Jian, the k parameter increasing by 1 (say from 1 to 2, or 2 to 3) does not imply that the edges have the same length. You can reformulate the k parameter to span the diagonal term over a longer range, or you can do that in post-processing when plotting the bandgap diagram.
Nagi Elabbasi
January 25, 2017Dear Clarence, if you are referring to the full structure simulations, they were done with the basic COMSOL Multiphysics package (no Modules required). It is a harmonic analysis with a displacement excitation at the left edge.
Clarence M. Wells
February 14, 2017Dear Nagi
what do you mean by ” no modules required ” or ” basic comsol multiphysics package ” ?
i am designing a demultiplexer. i can get the bandgap with perfect structure and get the defect mode with the structure having defects
but right now, i don’t know how excite elastic waves in structure to show the performance of my demultiplexer
can you explain a bit more? i really need this
truly
Nagi Elabbasi
March 4, 2017Dear Clarence, In my response above I meant that you only need the basic COMSOL Multiphysics package, not the additional Modules that may not be included in your license. The harmonic analysis I recommend is what COMSOL calls a frequency response study. I hope that helps. Regard, Nagi
Ahmed Mohamed
March 22, 2017i want to calculate the transmission spectrum for 2D solid solid phononic crystal and i am using solid module but i do not know what boundary condition i must use …
can any one know what boundary condition that help me to calculate the transmission coefficient ???
Sayeb Tadvin
March 24, 2017Dear Nagi Elabbasi,
I am new at COMSOL. I have designed a octagonal structure where I have created defect in two cladding holes by copper material. But now I cannot find out the bandgap curve for only the defect holes.
Plz sir give me some directions for finding the bandgap curve.
Thank you in advance.
Sayeb
Nagi Elabbasi
March 24, 2017Dear Ahmed,
I suggest you look at the COMSOL model I mentioned above in this thread called Sonic Crystal, Application ID 16925. There they apply a planar background pressure field in a frequency domain analysis. You can use a simpler approach in your model, also performing a frequency domain analysis with a harmonic pressure load applied at one boundary, and calculate the transmission loss as the ratio of average pressure between the ends of your periodic structure.
Nagi Elabbasi
March 24, 2017Dear Sayeb, I do not understand your phononic crystal structure. If you provide a figure or a reference hopefully I, or others who read this, can help.
Sayeb Tadvin
March 29, 2017Dear Nagi Elabbasi,
Sry sir for being late. Thank you for your quick response. I have sent an e-mail to your address nelabbasi@veryst.com by attaching the picture of my design as I couldn’t attach the file here.
Plz give me the procedure to get the photonic bandgap curve.
Thank you.
Sayeb
JIE ZOU
April 3, 2017Hi Dr Elabbasi, the problem I have is that this 2D model will not generate odd symmetry modes (odd about the x-y plane). Is it possible to calculate those modes using 2D models?
My workaround is to try 3D models. However, for a 3D model, how do we set kz at the Floquet boundary? Thanks a lot!
Kiumars Aryana
April 11, 2017Dear Nagi,
In your animation the left boundary uniformly moves back and forth and therefore, we can see the propagation of wave throughout the structure. I used frequency domain with applying pressure on one end but I cannot see the propagation of waves. Can you tell us more about the post processing of your model.
Thank you,
Kiumars
Clarence M. Wells
April 16, 2017dear nagi
i have no problem with your simulink
and exactly i use your ways in my simulink
but when i try to simulink the other articles on comsol
my dispersion cure is some Straight lines with no curvatures
where is my problem in your opinion ?
thanks for your attention
Mohammad Rafiee
April 22, 2017Dear Nagi,
Thank you for sharing this model. It was really helpful.
After getting the Band Structure, I need to get the Density of States.
I think I should compute Eigen frequencies in the interior part of the 1BZ.
How should I define parameters for this study and how should I sweep
them to cover the entire geometry?
Is there any facilities in COMSOL for calculation of density of states?
Anisuzzaman Boni
August 2, 2017I am trying to find band diagram of a photonic crystal.My unit cell has periodic boundary condtion in x and y direction .But z direction is open and also kz=0( no propagation).wave is only propagating in x and y direction.
PML and scattering boundary condition has been used in top and bottom(open boundary).But the problem is the wave is reflecting back to the computational domain.I have tried to increase the thickness and absorption coefficient(scaling factor).But no improvement has been found.
I have also varied the distance of PML layer from the substrate and the thickness of the substrate from lambda to 10*lambda(to check when the eigen frequency become independent those variation).But no feasible conclusion could be made.
could PEC or impedence boundary conditon be an option.
Could you please suggest me.
Thanks in advance.
Anisuzzaman Boni
Domenico Tallarico
October 14, 2017Dear Dr Elabbasi,
Thank you for sharing your interesting work. It is very helpful to illustrate the concept of stop-bands and passbands. However, I wonder whether it can be of any help in the accurate modelling of the scattering (reflection and transmission) from a phononic crystal (in-plane elasticity). My most serious concern is with the way you excite the plane wave. Prescribing the displacement to be an incident plane wave at the left interface, is different from having the reflected + incident field, as it should be. Any hint on how to overcome this limitation? Is a time-dependent analysis the (only) way forward?
Best wishes,
Domenico
Abdulrahman Alsolami
February 2, 2018Hi Dr. Elabbasi,
I really appreciate your work in this model, it was extremely helpful for me in my research area
I have a question regarding the verification of your phononic structure, I used the same verification method you used using frequency response study and it worked perfectly well. However when I use the time dependent study at a specific frequency in the band gap I can still see that the wave is propagating in the phononic crystal and not rejected! I come to realize that the time dependent can not be used for verification method and if that is the case then my question is why?
My other question is that is there a way of determining the number of phononic crystals I need for wave reflection instead of having randomly number like the one you used which is 11×11 array in your simulation? Can you give me clues or ideas of what I should do to determine that or if you could refer me to helpful model which I can start from!?
Thank You
Regards,
Abdulrahman
Mohammed Rababeh
October 21, 2020Hello,
can you please share the verification model, i’ve been trying to remodel it but i couldn’t get it to work.
Thank you
amr sherif
April 25, 2018Hi Dr. Elabbasi
i believe that is the greatest design for BG PHC
my question
i have changed the dimension for the unit cell to about hundreds nano meter which it matched with my design but here the problem there is some error in result and the plot doesn’t appear as same as you did, what could i change to get same result if i change the dimensions to [nm]?
Tanju Yildirim
August 3, 2018Hi Dr. Elabassi,
I am trying to recreate the larger structure with the 11 by 11 matrix and the 4 rectangular panels. After creating the matrix and applying these square boxes, I am still unable to obtain the simulation you have posted on the website. After the matrix is formed all the possible eigenfrequencies of the matrix are everywhere and there is no clear formation of the same bandgap. Did you apply any tricks on these periodic boundary conditions to have them the same when moving to the matrix formation? I am just applying a periodic displacement for the input biration at 67.5 kHz. I have put fixed displacement at three ends of three of the rectangles looking at your video simulation. However, when moving to the structure, the waves propagate at 67.5 kHz still so I after the matrix formation how to keep the appropriate boundary condition for the Floquet in the entire structure so there is still a bandgap at 67.5 kHz.
Your help is most appreciated
Kind regards,
Tanju
Helio Cantanhede
September 17, 2018Hi Dr. Elabassi,
I can not download the described files, could I make it available?
Your help is most appreciated
Kind regards,
Helio Cantanhêde
dave john
October 12, 2018Hi Dr. Elabbasi
Thank you a lot about perfect simulation of band structure. i worked as project in Acoustic sensors based on PnC and i have some questions:
1) how i can get a transmission for different line defect (liquids mixture)?
2) in our simulation we are utilize constant physic( acoustic pressure frequency domain) we are in correct way?
3) Finally, explain how i am making a boundary condition for transmission?
Kind regards,
John
Nagi Elabbasi
October 13, 2018Sorry the COMSOL Multiphysics model associated with this Blog disappeared for some reason. I re-posted it to the Application Exchange. Here is the link: https://www.comsol.com/community/exchange/642/
amr sherif
November 7, 2018dear Nagi
could you pleas discuss how do i use same concept but instead of using mechanical structure i want to use electromagnetic wave physics because i want to make relation between refractive index to help me for choosing which material i want can you explain that pleas ?
Brianne Costa
November 12, 2018Hello Amr,
Thank you for your comment.
For questions related to your modeling, please contact our Support team.
Online Support Center: https://www.comsol.com/support
Email: support@comsol.com
1 1
April 23, 2020Can you share the later transmission model?thank you
youcef sayad
February 8, 2019Please need a video illustrating this example.
youcef sayad
February 8, 2019sayadyoucef8@gmail.com
Please
shahab amanat
December 18, 2019Hello, Dear.Nagi,
Your example was really useful. It helped me to model a unit cell of meta barriers in the soil, but I could just get acoustical phonon branches (I have increased the desired number of eigenfrequency, but my result had more acoustical branches and no optical branch.)
I wonder if you can give me some advice, especially on how to get an optical phonon branch.
Best,
Amanat.
无名 刘
April 5, 2020您好,我在进行二维声子晶体板波能带结构的仿真过程中遇到一些问题,想要请教您。
在仿真过程中我想要去掉其中的反对称型兰姆波的模态,仅对对称型兰姆波的能带结构进行分析,我该如何在comsol中设置来实现这一目的。
谢谢。
1 1
April 23, 2020Can you share the later transmission model?
Husam Walwil
May 25, 2020Hi Nagi;
If i make the primitive cell with with two squares. Meaning i keep the period but i change the internal square size. Will i get the same dispersion?
Thnx
Husam
Jannatul Ferdous
October 24, 2020How can I find the band diagram of a Helmholtz resonator? What will be condition for kx and ky then?
Sanjay Kumawat
June 27, 2021Hi,
Can I calculate bandgaps for 1D phononic crystals in COMSOL? If yes, pls show me how? I have been trying it using periodic continuity BC and periodic Floquent BC, but unable to differentiate the bandgaps for p wave and s waves, hence getting random dispersion curves.
Maria J Carrillo Munoz
July 29, 2021How can we get the dispersion curves for k imaginary?
Yuefeng Yu
May 11, 2022Hi Nagi, thanks for your nice description! I have two questions about understanding the band structure: where is the fundamental vibration mode (the lowest-frequency mode) shown on band structure? it must be larger than 0Hz; and what does (k=0, f=0) mean on bandstructure?
Arshad Khan
September 2, 2023How to apply sound cone and strain energy methods to distinguish surface waves from bulk waves? Can anyone guide me?