Time-Of-Flight Experiments In A Scanning Electrochemical Microscope
Scanning electrochemical microscopy (SECM) is a technique for recording spatially resolved electrochemical signals. In a typical SECM experiment an ultramicroelectrode (UME) is immersed in an electrolyte over a sample. Additionally, an electrochemically active species called mediator is present in the electrolyte. To perform an experiment a potential is applied to the UME and the resulting current recorded while the UME is being moved in x, y, or z-direction.
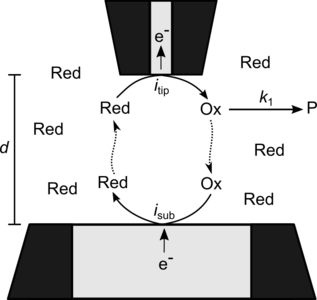
In this contribution we employ COMSOL Multiphysics® to simulate electrochemical time-of-flight (TOF) experiments in a SECM. For a TOF experiment, the sample is replaced by a second UME. If suitable potentials are applied to both UMEs the mediator is oxidized at the first UME (tip) and collected at the second UME (substrate) by reduction. This enables a current flow between the UMEs if the gap is small enough. The collection efficiency – the ratio of substrate UME current to tip UME current – depends on the properties of the mediator, electrolyte, and the size of the gap. If the oxidized form of the mediator is depleted by a homogeneous reaction while diffusing across the gap a drop in collection efficiency is experienced. The distance-dependent collection efficiency curves then contain information about that reaction mechanism and the reaction rate constants [1] [2] [3].
To simulate such an experiment with COMSOL Multiphysics®, a 2D-axisymmetric geometry of the space containing the gap and the tops of both UMEs was constructed. The physics of the problem were set up through the Electroanalysis interface from the Electrochemistry module. Instructions for setting up the boundaries of the UMEs and domain equations as well as the mesh were taken from the “Voltammetry at a Microdisk Electrode” application from the COMSOL® Application Library.
We intend to use this model to simulate collection efficiency curves with different reaction mechanisms and rate constants to interpret the data of our lab experiments.
[1] S. Bi, B. Liu, F.-R. F. Fan, A. J. Bard, J. Am. Chem. Soc. 2005, 127, 3690. [2] J. Chang, A. J. Bard, J. Am. Chem. Soc. 2014, 136, 311. [3] F. Cao, J. Kim, A. J. Bard, J. Am. Chem. Soc. 2014, 136, 18163.
Download
- Sebastian_Pleis_Poster.pptx - 0.59MB