

The thermochemical process of pyrolysis, where materials are decomposed at high temperatures in an inert atmosphere, converts biomass into products such as solid charcoal, which can further be refined into hydrogen through gasification. In this blog post, we explore a model of pyrolysis applied to a wood particle and discuss how parameter estimation can help optimize this process.
History and Uses of Pyrolysis
In ancient times, pyrolysis was typically conducted by placing wood in a pit covered with material such as dirt to block air from reaching the inside. This method allowed the wood to smolder without combusting. During the process, vapors would release from the wood, which later condensed into tar. This form of pyrolysis was often used to produce tar and charcoal, with the tar being using to impregnate wood for ships and the charcoal being used in the process of iron smelting.
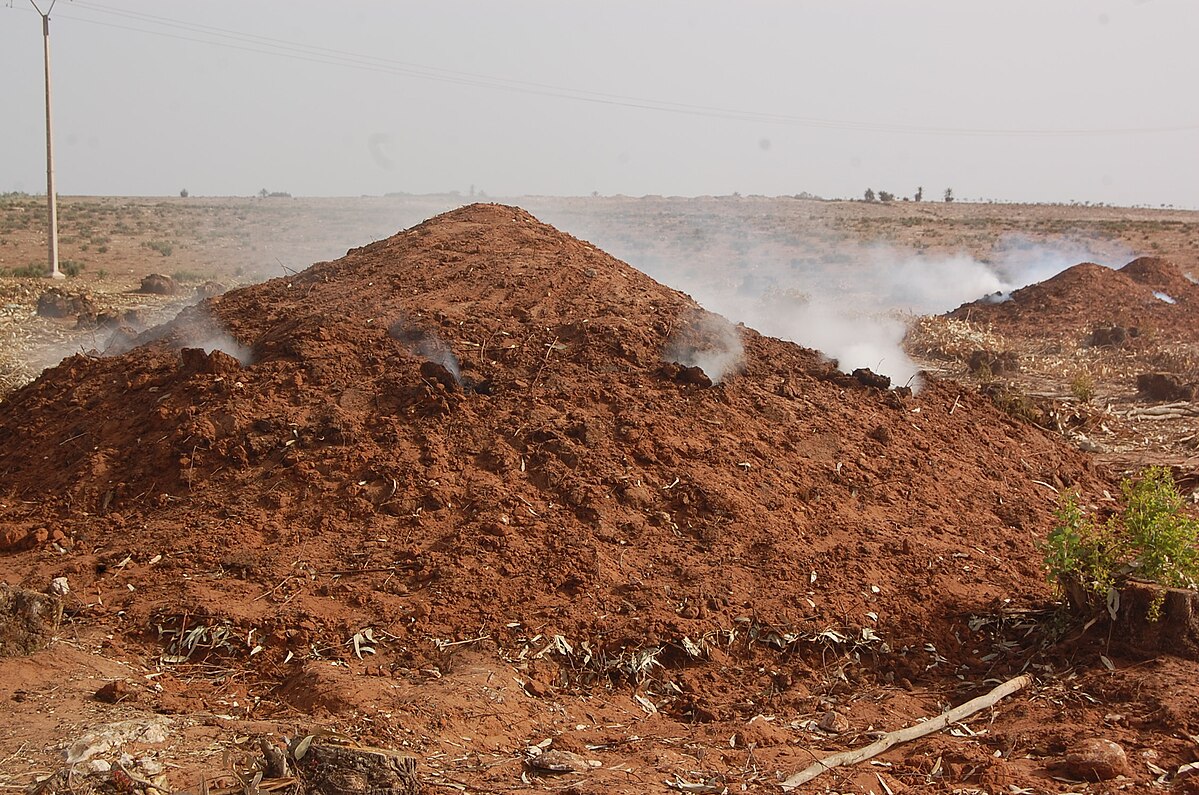
Charcoal production using the pit method of pyrolysis. This image is licensed under the CC BY-SA 4.0 via Wikimedia Commons.
Now, steel reactors are used to create an inert atmosphere, and pyrolysis is used in the chemical industry to produce forms of carbon and other chemicals from petroleum, coal, and wood.
In addition, pyrolysis is the first step in gasification, a process that further converts biomass into hydrogen by reacting the biomass with components such as steam at elevated temperature. One technical issue that can arise during gasification of biomass is that the produced tar condenses within the equipment, causing clogging. By using pyrolysis as a pretreatment, the biomass can be converted into a high-energy-density char that produces less tar during gasification and that is easy to mill and cheaper to transport. Another way of producing hydrogen through pyrolysis is methane pyrolysis, where methane decomposes into carbon and hydrogen.
By using modeling and simulation, chemical engineers can optimize the pyrolysis process by predicting the product ratios as a function of pyrolysis process conditions. The model parameters needed for such simulations can be derived using experimental data and parameter estimation. Next, we’ll explore one such model example…
Modeling Pyrolysis
The Parameter Estimation for Pyrolysis of Wood model can be built with the Chemical Reaction Engineering Module, an add-on product to the COMSOL Multiphysics® software. This model includes parameter estimation, functionality for defining multiple objectives from experimental data, and a range of solvers — all capabilities introduced in version 6.2 of the Chemical Reaction Engineering Module.
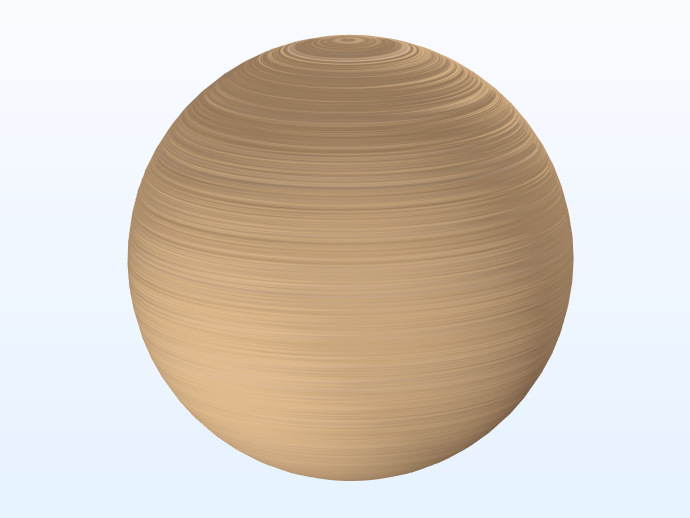
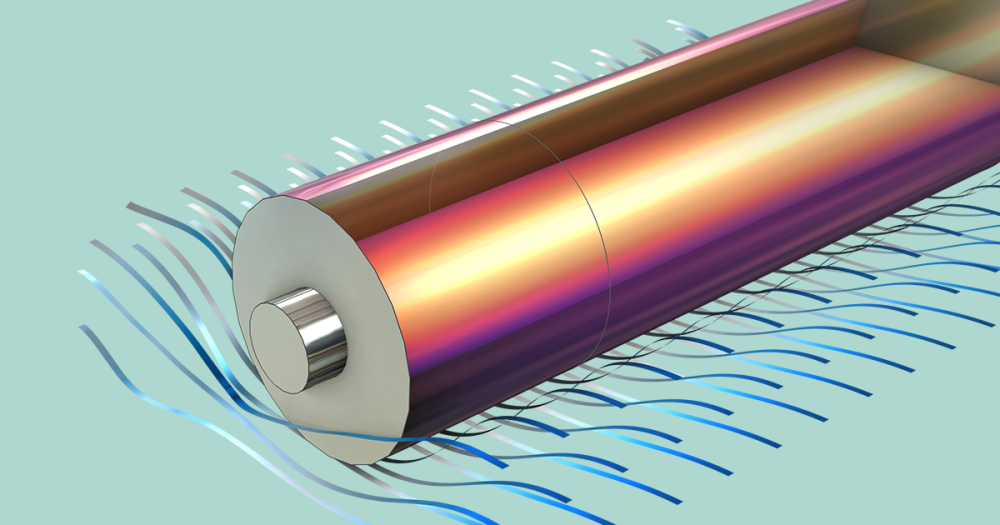
The modeled biomass is a spherical centimeter-sized wood particle with anisotropic heat and mass transfer properties.
Setting Up the Multiphysics Model
The model is split into two parts: The first part demonstrates how to set up a model describing the pyrolysis process, momentum transfer, and heat in an anisotropic wood sphere, while the second part showcases how to use parameter estimation to optimize the model. The estimated parameters are one Arrhenius constant, two reaction heats, and one external heat transfer coefficient.
The products of pyrolysis depend on multiple variables, such as feedstock type, heating rate, and process duration. Due to the complexity of the reaction mechanism, so called lumped-reaction models are often used. The reaction products are lumped together based on their phase. The resulting pseudospecies are then used to set up a simplified reaction scheme that can be used for engineering purposes.
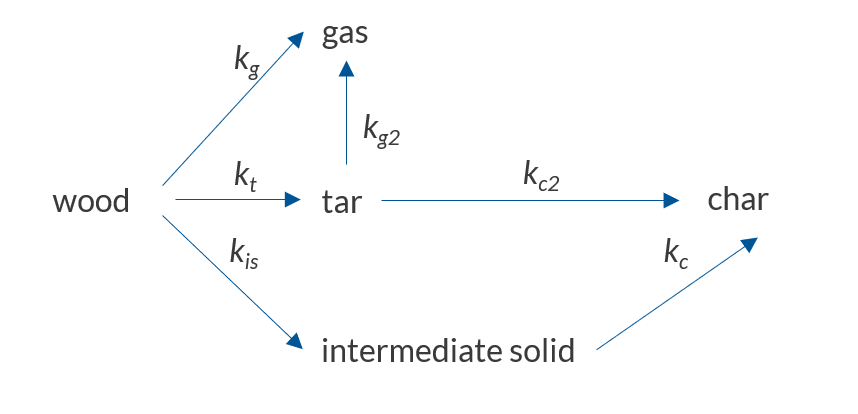
The reaction scheme used in this model.
This reaction scheme describes primary and secondary pyrolysis reactions. The primary decomposition converts the wood into the pseudospecies gas (species that do not condense at room temperature), tar (all condensable volatiles), and an intermediate solid. During the secondary decomposition, the produced tar is further decomposed into gas or char, and the intermediate solid is decomposed into char. When the gas and tar leave the particle, it results in a mass loss that can be measured experimentally. In this reaction model, the primary reactions are all endothermic, meaning that they will require heat, while the secondary reactions produce heat, as they are exothermic.
Using Parameter Estimation to Optimize the Model
Parameter estimation problems consist of three components: experimental data, a forward model that represents the physics of the experiments, and an optimization algorithm that compares the two and updates the model parameters to minimize the difference.
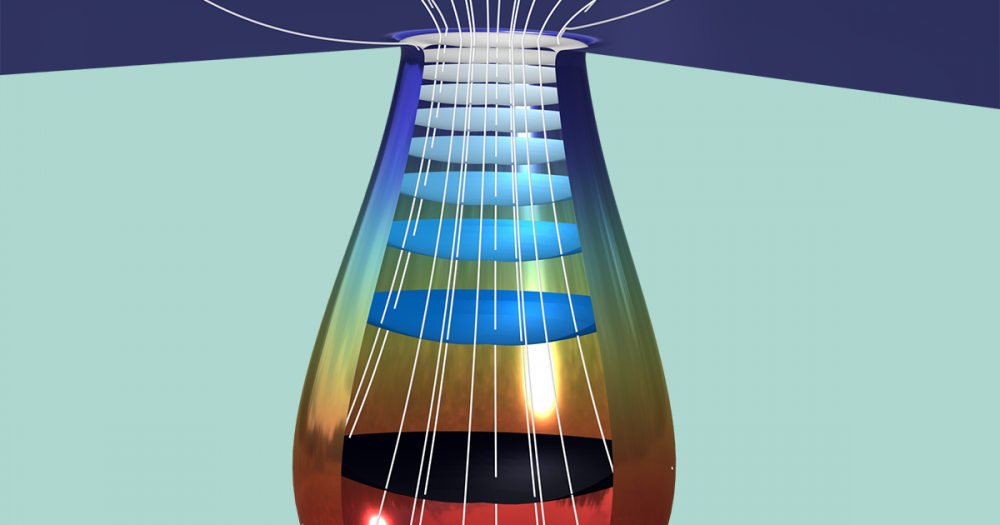
The experimental setup used to collect measurement data consists of a furnace with an inert atmosphere achieved via nitrogen flowing through the furnace chamber. The temperature of the furnace is kept constant. The wooden sample is inserted into the hot furnace, and the temperature and mass of the sample are recorded during the pyrolysis process. The temperature gradient is measured at three positions within the sample: at the surface, mid, and center position along the anisotropic wood fibers in the horizontal direction.
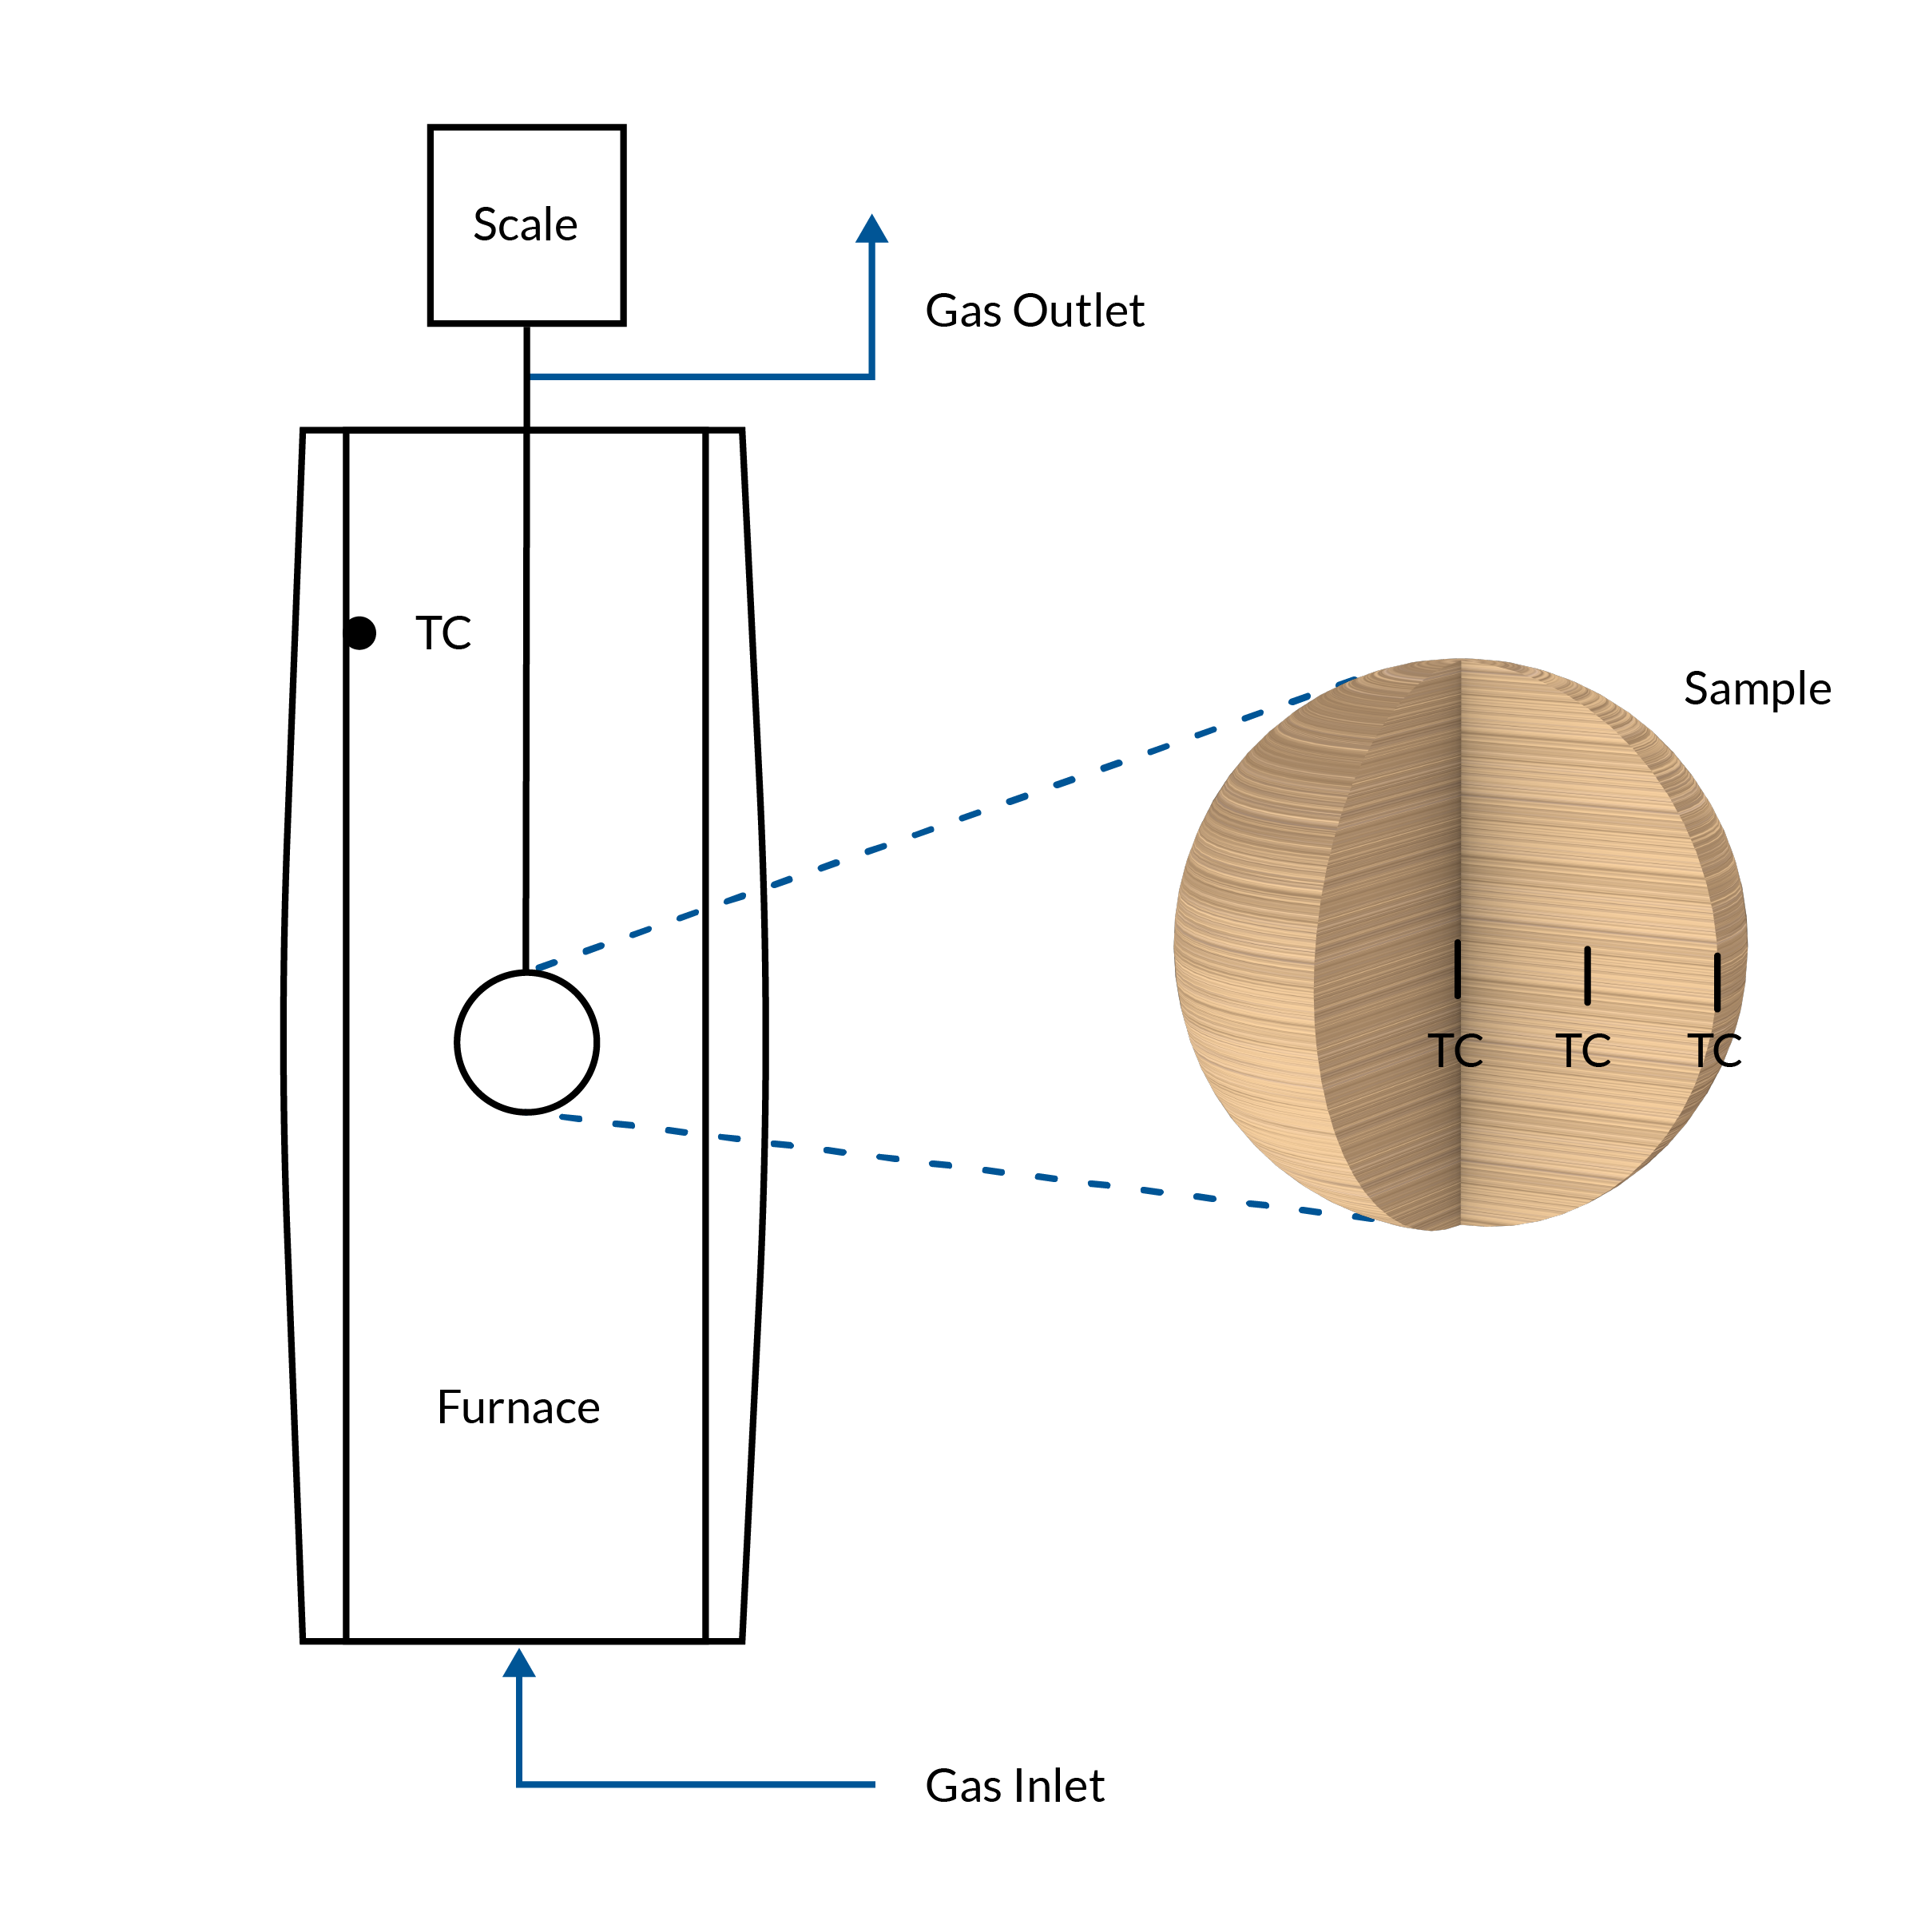
The experimental system, including the wood sample within the isothermal furnace.
The forward model describes the pyrolysis reactions, mass transfer, fluid flow, and heat transfer in the centimeter-sized wood particle. In this example, both the conductive heat transfer and the permeability of the solid are anisotropic.
Optimizing the Model
Without optimization, the forward model describes the trend in temperature quite well, but the final mass in the experiment is not captured at all. After parameter estimation, the optimized model captures the timing of the peak temperature in the center of the particle, and the final mass is accurately described.


Left: Model prediction of the surface and middle temperatures, comparing the results from the forward model (solved with initial values for the estimated parameters) and the optimized model with experimental data. Right: Model prediction of the center temperature and the normalized solid mass, comparing the results from the forward model and the optimized model with experimental data.
Evaluating the Results
From the previous images, we saw the total solid mass of the particle as a function of time. Below, we have illustrated the evolution of each of the solid species in time and space. Early in the process, there is mainly wood. This wood is converted through primary pyrolysis reactions into gases and the solid intermediate species (is). Late in the process, the secondary pyrolysis reactions have further converted these species, and most of the particle consists of char.

Normalized densities of the wood, intermediate solid, and char at three different times.
Now let’s take a look at the temperature, heat source, and mass source associated with the process. During primary pyrolysis, early in the process, wood converts into the intermediate solid, gas, and tar. This gives a positive mass source (gas is formed), and a negative heat source, since the primary pyrolysis reactions are endothermic. Mid process, around 270 s, the char-forming secondary processes have begun, as seen through less gas production and higher heat source. Finally, late into the process, only secondary pyrolysis reactions occur, giving rise to a temperature peak in the particle center due to the evolved heat.
 Heat source, mass source, and temperature at 150 s.
 Heat source, mass source, and temperature at 270 s.
 Heat source, mass source, and temperature at 433 s.


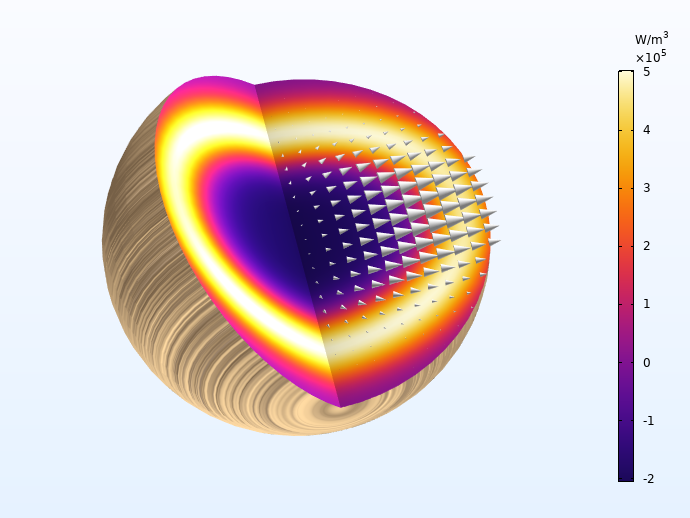
The two exothermal charring reactions give rise to a heat source front moving toward the center of the particle. The arrows indicate the total mass flux, which is highest along the fiber direction.
Next Step
Want to try the model for yourself? The MPH-file and step-by-step instructions are available in the Application Gallery:
Further Reading
- Learn more about pyrolysis and its applications from these resources:
- Read more about modeling biomass on the COMSOL Blog:


Comments (0)