

A while back, I bought a bag of marshmallows, indulged a bit, and then forgot about the opened bag for a few weeks. To my surprise, and disappointment, when my marshmallows cravings returned the top ones were rock-hard while the bottom ones were almost as soft as when I bought them. Why was this the case? By leaving the bag open, water had migrated from the marshmallows into the air.

Open bag of marshmallows.
What’s the Diffusion Coefficient of Water in a Bag of Marshmallows?
Finding my open bag of partially dried-out marshmallows raised the question: what is the diffusion coefficient of water inside the marshmallows bag? I realized that this could be answered by observing what happened to the open bag of marshmallows on my counter; I knew the geometry of the bag, what day it was opened, and I assumed that the “marshmallow water content profile” after 30 days was a straight line. This was the experimental profile I used to set up a mass transport by diffusion simulation with the goal of deducing the diffusion coefficient of water in the bag of marshmallows (hereon referred to as Diff).
Note: In order to find the value of water content at each end of the experimental profile, I needed the water concentration values of both the air and the fresh marshmallows. The former can be derived by knowing that the absolute humidity of air with a relative humidity of 30% at 20°C is ≈5.2 g/m3, which corresponds to a water concentration ≈0.3 mol/m3. While for the latter, I had to do some research and decided to use the data provided here, corresponding to a water concentration of ≈7,781 mol/m3.
Simulating Mass Transport by Diffusion
The initial water concentration in the bag is 7,781 mol/m3 while its value at the open end of the bag is 0.3 mol/m3. In the figure below the geometry is shown that is used for the simulation along with the line where the experimental profile will be compared with the simulations for Diff.
 |
 |
Marshmallow bag geometry and profile line along which the simulated water concentration is compared to the experimental profile.
I ran the simulation for different values of Diff, expressed in m2/s, and compared the results to the experimental profile (see plot below). The value of Diff that best fit the experimental profile was 2·10-9 m2/s.

Simulated water concentration vs. experimental profile.
 |
 |
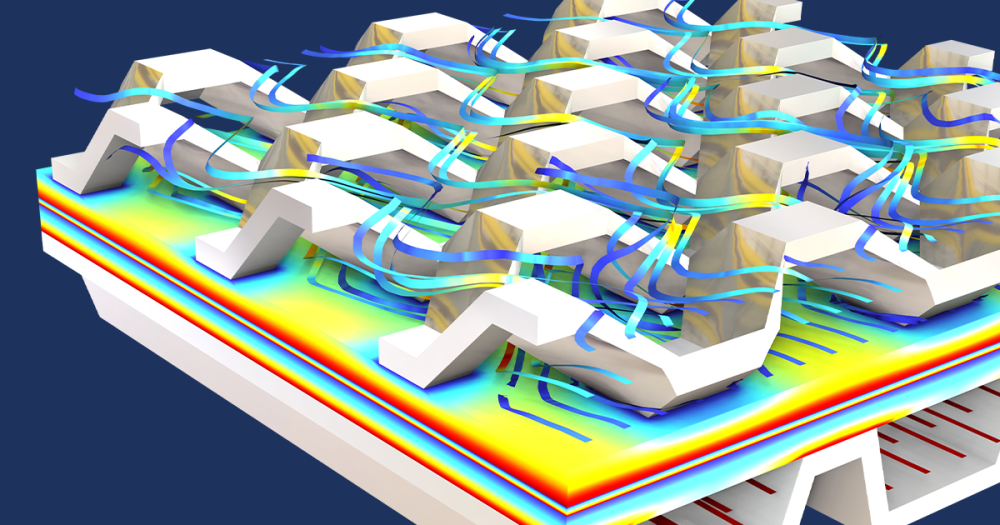
Isosurfaces and surface plots of water concentration for Diff=2·10-9 m2/s.
Discussion and Next Steps
Even if I had to rely on several simplifying assumptions — an experimental profile determined “by hand”, a diffusion coefficient independent from water concentration, time, shape and packing of the marshmallows, chemical reactions and constant boundary conditions — I’ve been able to establish the order of magnitude of the diffusion coefficient and started to understand more about what is happening.
I might even try different bag shapes to find out which shape is less prone to dry out the marshmallows. The next step could also be to include all the effects that I’ve neglected here in a new simulation that would accurately answer the question: how long does it take to dry all the marshmallows out?
Well, in my case, after a couple of months, a quarter of the bag is still edible. You can start from the information provided in this post, run your simulation, and let me know when the last marshmallow will be as hard as a rock!
Further Reading
There’s a lot of applied physics at work when cooking food. If you’re intrigued by this, check out the following resources:
Plenty of simulations related to the food industry have also been presented at the COMSOL Conference over the years. Here are a few that grabbed my attention:


Comments (2)
Euler Integral
March 31, 2014Hi,
It’s very nice to use comsol to this kind of problem. No other software offers a blog as good as this one.
But I think the analysis of the problem is a little bit wrong.
There where a lot of YouTube vlogs recently talking about why bread becomes hard when exposed to air.
The general belief is that the moisture get out of the bread. But what really happens is that the moist of the air goes inside the bread, crystallizing sugar, and is this crystallization that makes the bread becomes hard.
A experiment to decide what really happens is simple. weight the bread before and after. If the weight increases, the air moisture is being absorbed and crystallizing the sugar, while if it loses weight, it will be losing water content.
In bread what really happens, as stated, is sugar crystallization. So my belief is that in marshmallows, the same happens.
The analysis uses the assumption that it loses weight (Water) so by comparison is unreliable.
I don’t know how you would simulate sugar crystallization in Comsol, but anyways, the phrase “water had migrated from the marshmallows into the air” is a little bit too strong without any resources backing that up.
Valerio Marra
April 3, 2014Hello,
As I pointed out in the post, I had to rely on several simplifying assumptions and just wanted to establish the order of magnitude of the diffusion coefficient.
I agree with you that more phenomena might be involved. That simulation can be thought as the starting point for a more complex analysis where, by following an incremental approach, more physics can be added. The engineer, or researcher, will then verify and validate is model against experimental data, optimize his design, and so on.
Food engineering is a very interesting topic and if you’re curious to know what COMSOL users are simulating, I suggest to search for the word food on comsol.com:
– http://www.comsol.com/search/?s=food&subset=success_stories
– http://www.comsol.com/search/?s=food&subset=papers_presentations
Thanks for reading the blog and your feedback!
Valerio