
There are many different routes through which drugs and other medications can be delivered into a patient’s body during treatment. These include topographical ointments, pills, vaporizers, and injection systems, among others. Many of these drug delivery systems require an enormous amount of precision when it comes to the location, timing, concentration, and amount of the drug to be administered. This is where simulation can be a big help, as it can allow for the modeling of each of these aspects of the drug delivery system. When it comes to drug delivery, ensuring that the proper dosage of the drug is administered is key.
Modeling Drug Delivery on the Microfluidic Scale
In a drug dosing system, such as what might be employed by an intravenous (IV) therapy device, the concentration of the drug needed to be delivered into the bloodstream can be incredibly precise. In these systems, the delivery of a drug must be exact; even the smallest difference in amount could potentially inflict harm on the patient. In order to ensure that the correct dosage of a water-soluble drug can precisely and accurately be administered, we can use multiphysics modeling to analyze and optimize the system. In this microfluidic device, we can model the fluid flow of a water droplet as it travels down a capillary tube and comes into contact with a drug concentration. This concept is illustrated in the figure below:
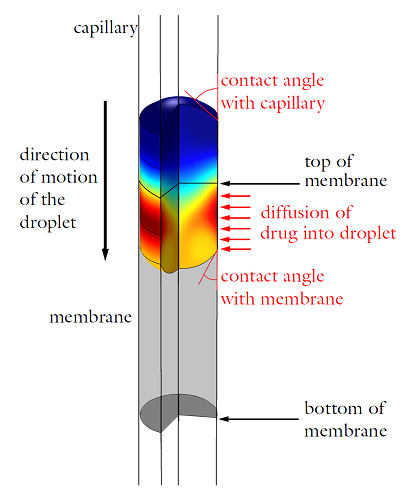
Diagram detailing the operating principle of the drug delivery device. The droplet’s color represents the concentration of the drug. As the droplet passes through the section of the capillary surrounded by a permeable membrane, the drug concentration increases (from blue to red).
Because the capillary tube is a cylindrical shape, an axisymmetric geometry can be used to represent the system. A certain section of the capillary tube has its surface coated in a permeable membrane containing a concentrated solution of the drug. When the surface of the droplet comes into contact with the membrane, the drug will diffuse inwards, dispensing the desired dose into the water. The final concentration of the drug within the system will depend on the velocity at which the water droplet is traveling as it passes through the membrane — when the droplet is only in contact with the membrane for a brief period of time, less of the drug will dissolve than if the droplet was touching the membrane for an extended period of time. By varying the velocity of the water droplet, the final concentration of the drug in the droplet can be regulated.
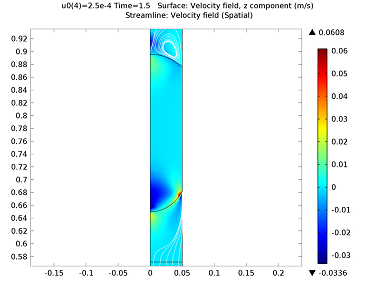
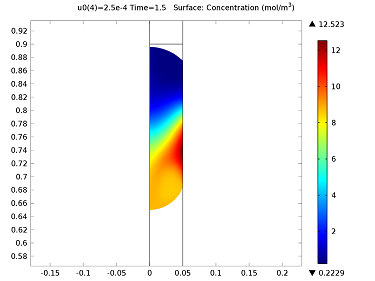
Initially, the water droplet is stationary at the top of the capillary tube. When the droplet is released, it travels down the capillary tube and accelerates to a constant velocity before reaching the permeable membrane. The diffusion coefficient of the drug in the water is 5×10⁻⁹ m2/s. As the surface of the droplet is exposed to the membrane, its velocity is varied between 0.1 and 1 mm/s in order to obtain the final concentration. The velocity field and concentration profiles are quite complex when the droplet first comes into contact with the membrane. Far away from the droplet, the velocity profile corresponds to Poiseuille flow, but near the surface of the droplet, vortices and nonuniformities are present. This is due to the fact that the entire droplet is moving at a fixed velocity of 0.25 mm/s as it passes the membrane. The constant velocity across the width of the capillary causes a significant redistribution of the flow field. This velocity profile occurs 1.5 seconds into the simulation. We can use a simulation to examine the flow field velocity surrounding the droplet and the concentration of the droplet as the drug diffuses into the water. The complex flow field and concentration profile is shown below:
Analyzing the Concentration Profile in the Droplet
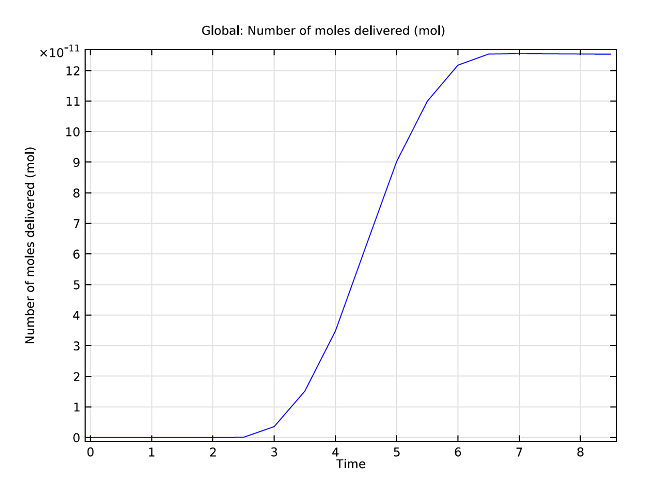
We can examine the total amount of the drug that has diffused into the droplet as a function of time. In the graph below, we analyze the quantity of the drug in the droplet when the drop is traveling at a speed of 0.1 mm/s. As can be seen in the graph, the drug concentration increases with an s-shaped profile. The steady increase between 3 and 6 seconds corresponds to the time where the droplet’s surface is in contact with the membrane.
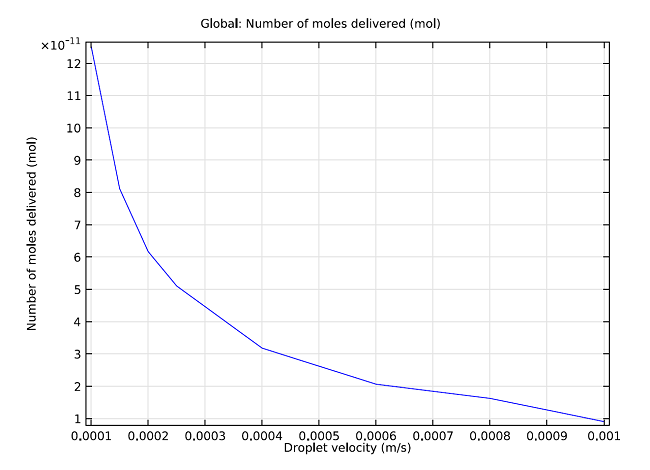
Additionally, we can measure the total number of moles delivered into the droplet against the droplet’s velocity. As can been seen in the graph below, the number of moles delivered into the droplet is approximately inversely proportional to the velocity of the droplet. Therefore, we can vary the amount of drug that is allowed to diffuse into the droplet by altering the time it takes for the drug to pass entirely through the membrane. With simulation, we are able to precisely and accurately anticipate the exact velocity needed in order to achieve a certain drug dosage. This system is accurate down to the picomole, and using simulation we can find the optimal velocity and time in order to administer a desired drug concentration.
Additional Resources
- Download the drug delivery system model
- Read the book, “Microfluidics for Biotechnology“




Comments (0)