
In my recent blog post about the official match ball of the 2026 FIFA World Cup®, the Adidas Trionda®, I discussed the aerodynamics of the ball and the impact dynamics during high-power trivelas, shots taken with the outside of the foot that exhibit a signature curved trajectory. In this blog post, I’ll turn to the sensors embedded in the ball and in the vests players wear under their jerseys. These systems contain MEMS accelerometers, gyroscopes, magnetometers, ECG electrodes, and RF communication systems that enable real-time tracking and analysis for coaching staff and video assistant referee (VAR) teams. I’ll also look at how these devices can be modeled and simulated using the COMSOL Multiphysics® software.
The Sensors on the Trionda
On May 3 this year, Manchester United secured a dramatic 3–2 win against Liverpool at Old Trafford. In the 14th minute, Benjamin Šeško scored the 2–0 goal for Manchester United. The goal became controversial because Šeško may have touched the ball with his hand just before it crossed the goal line.
However, because the Premier League does not use balls with embedded inertial measurement unit (IMU) chips, the VAR officials spent several minutes reviewing broadcast camera footage before ruling the images inconclusive and allowing the goal to stand.
This type of situation is less likely to occur at the 2026 World Cup. The Trionda contains a 500-Hz IMU chip consisting of MEMS accelerometers and gyroscopes. Even relatively small changes in acceleration and angular velocity caused by a touch of the ball can therefore be detected and analyzed in real time.
The sensors in the Trionda have already played a decisive role in the World Cup this year. In Sunday’s game between Sweden and Tunisia, Mattias Svanberg’s 4–1 goal for Sweden was initially disallowed because he was called offside. It appeared that Svanberg had received the ball directly from the free kick, in which case he would have indeed been offside.
However, the sensors inside the ball detected a tip-of-the-toe touch by Svanberg’s teammate Alexander Isak between the free kick and the shot on goal. Whether Isak touched the ball was difficult, if not impossible, to confirm from the camera footage alone. Because the sensors could determine the exact moment of contact, VAR was able to establish that the pass leading to Svanberg’s shot came from Isak rather than directly from the free kick. At the moment Isak touched the ball, Svanberg was no longer in an offside position, and the goal was therefore allowed to stand.
To add to the excitement, Svanberg had come off the bench mere seconds before the play and the goal was his very first touch of the match. Talk about timing, by both the coach and the player!
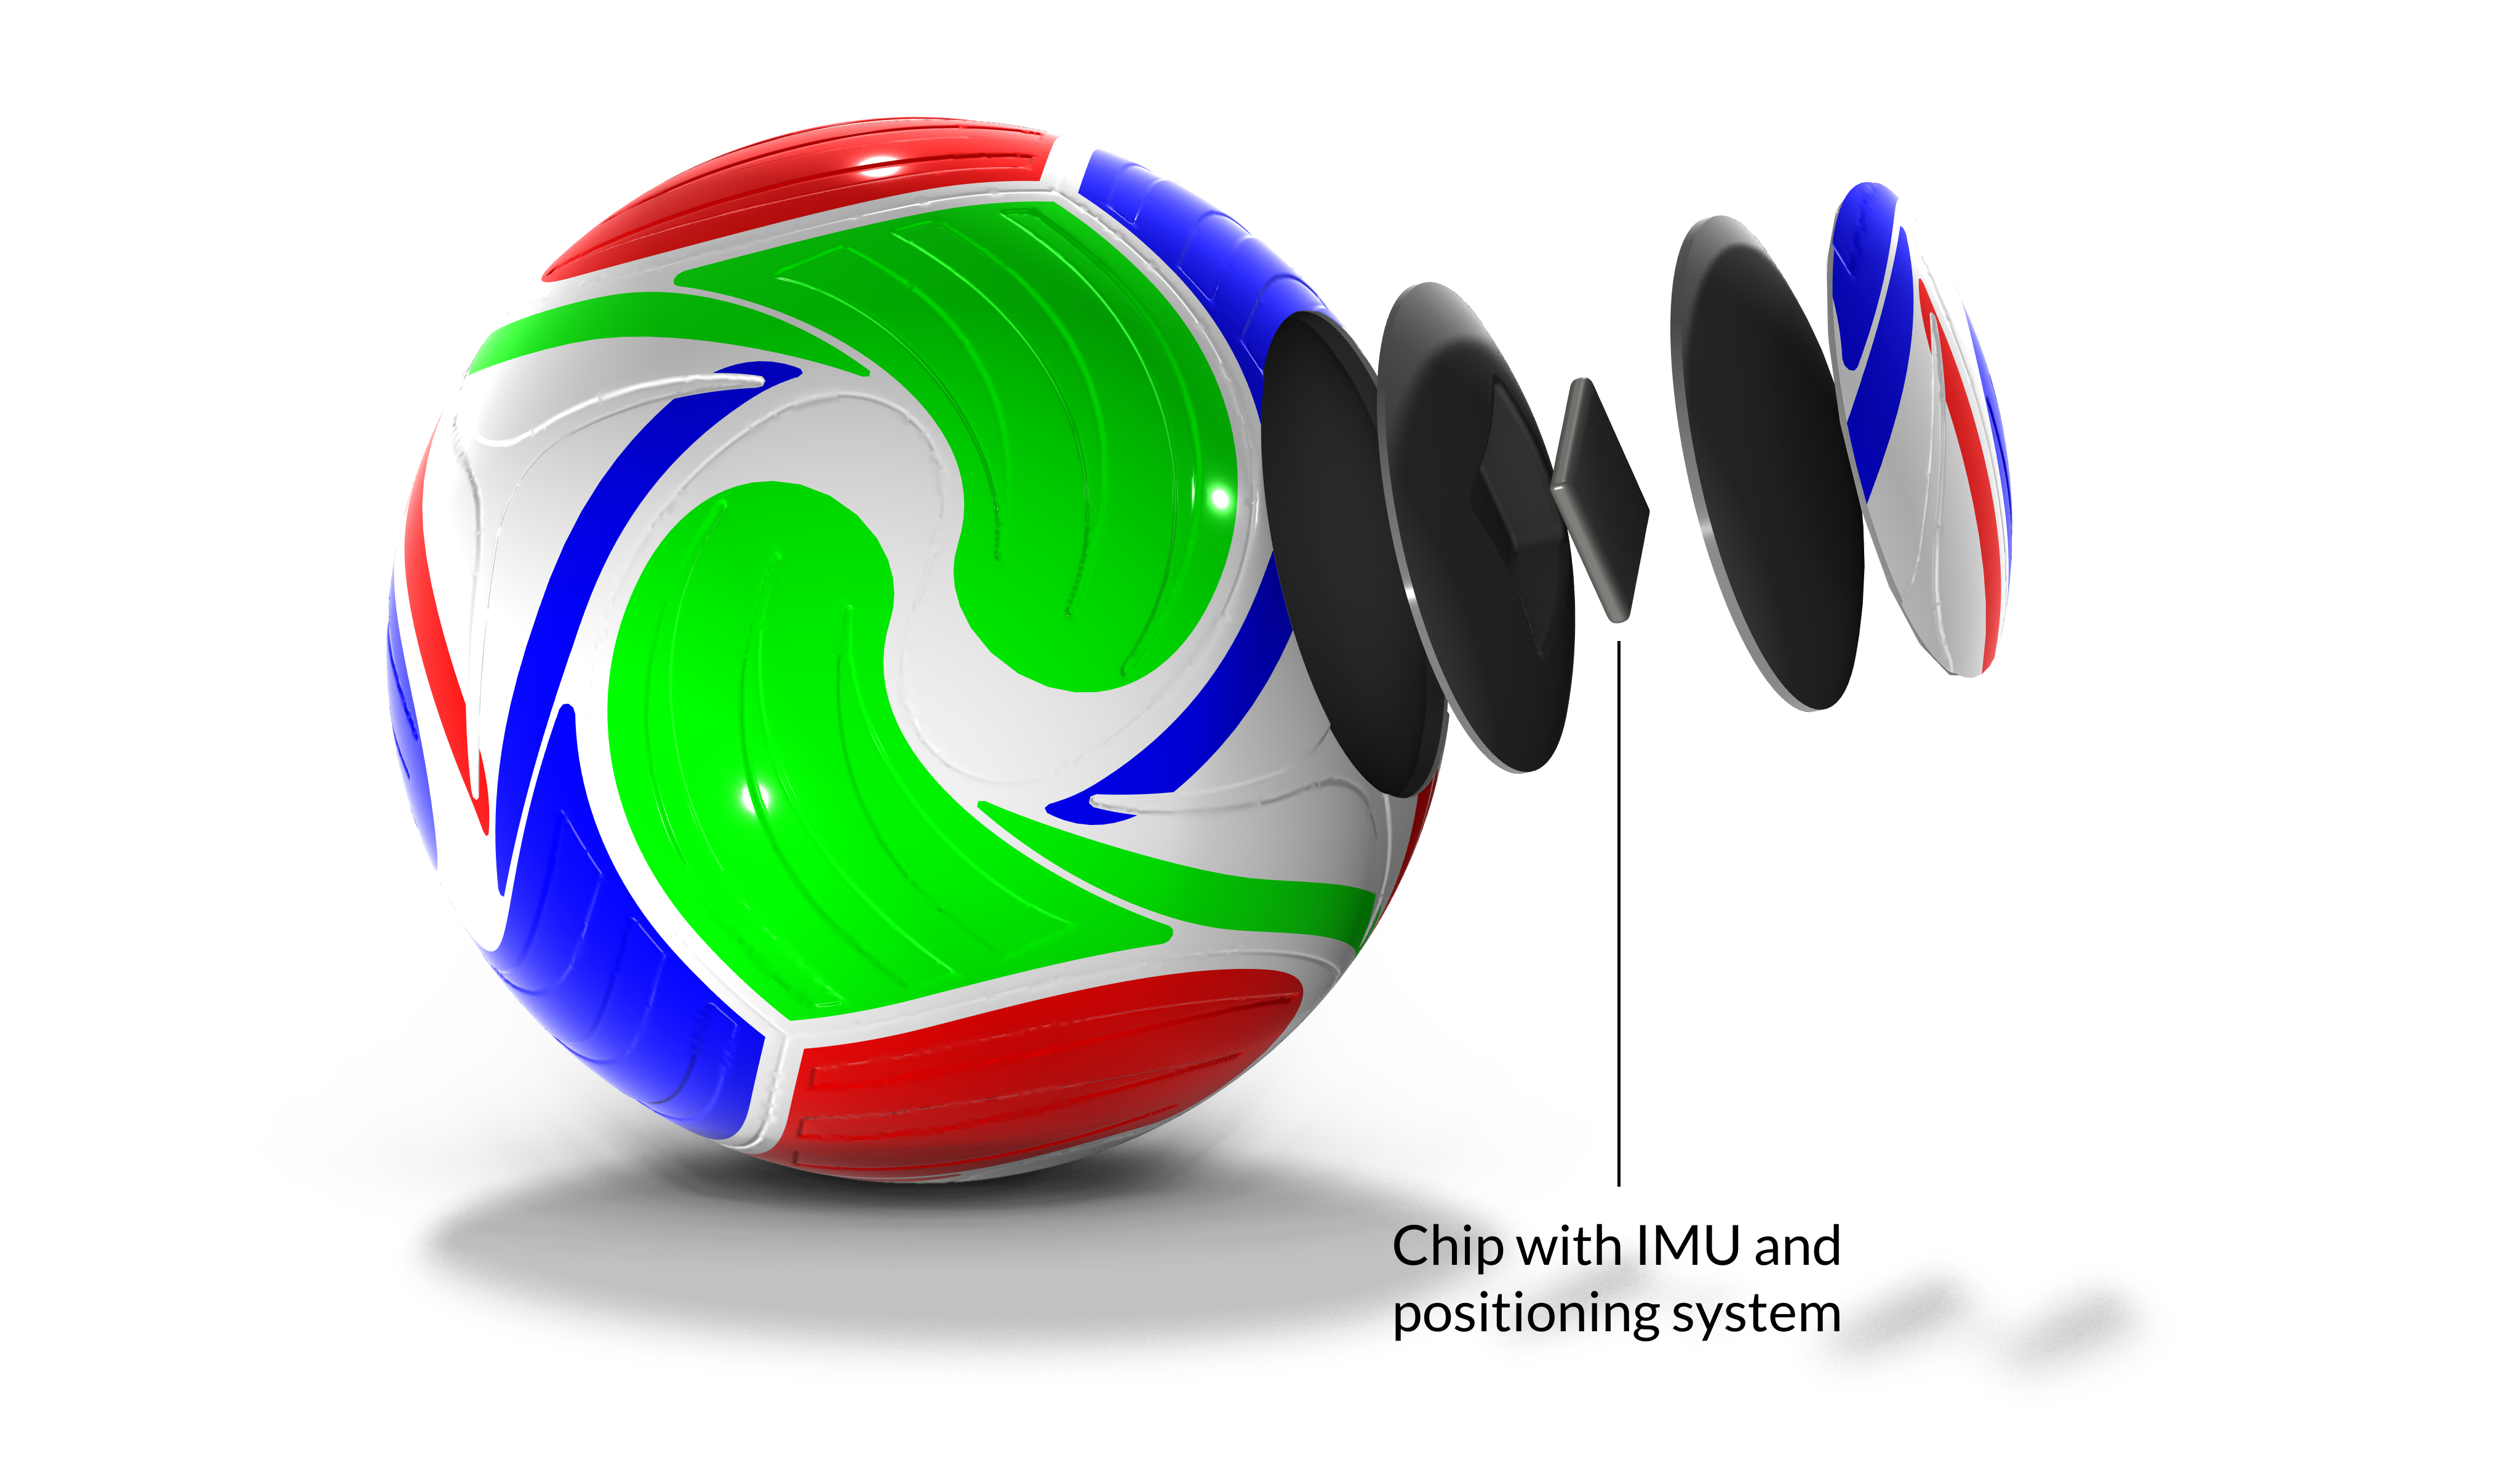 Schematic illustration created in COMSOL Multiphysics® of the Adidas Trionda, with the sensor chip placed in one of the ball’s four surface panels. Counterweights in the other three panels make the ball mechanically symmetric.
The chip inside the Trionda that’s making such call reversals possible was developed by Adidas in cooperation with KINEXON Sports. They have not publicly disclosed which IMU product was used to develop the chip. However, the published specifications of commercially available devices such as the TDK® InvenSense® ICM-20649 and ICM-45686 are strikingly similar to what one would expect from an IMU designed for football applications. These devices support angular velocities up to ±4000 degrees per second (dps) and accelerations up to ±32 g. Interestingly, the datasheet of the ICM-20649 explicitly mentions “soccer ball kicks” as a target application. TDK’s MEMS MotionTracking® devices integrate three MEMS accelerometers and three MEMS gyroscopes, together with signal conditioning electronics, analog-to-digital converters, temperature sensors, and communication interfaces, into a compact 2.5 × 3 × 0.81-mm hermetically sealed package.
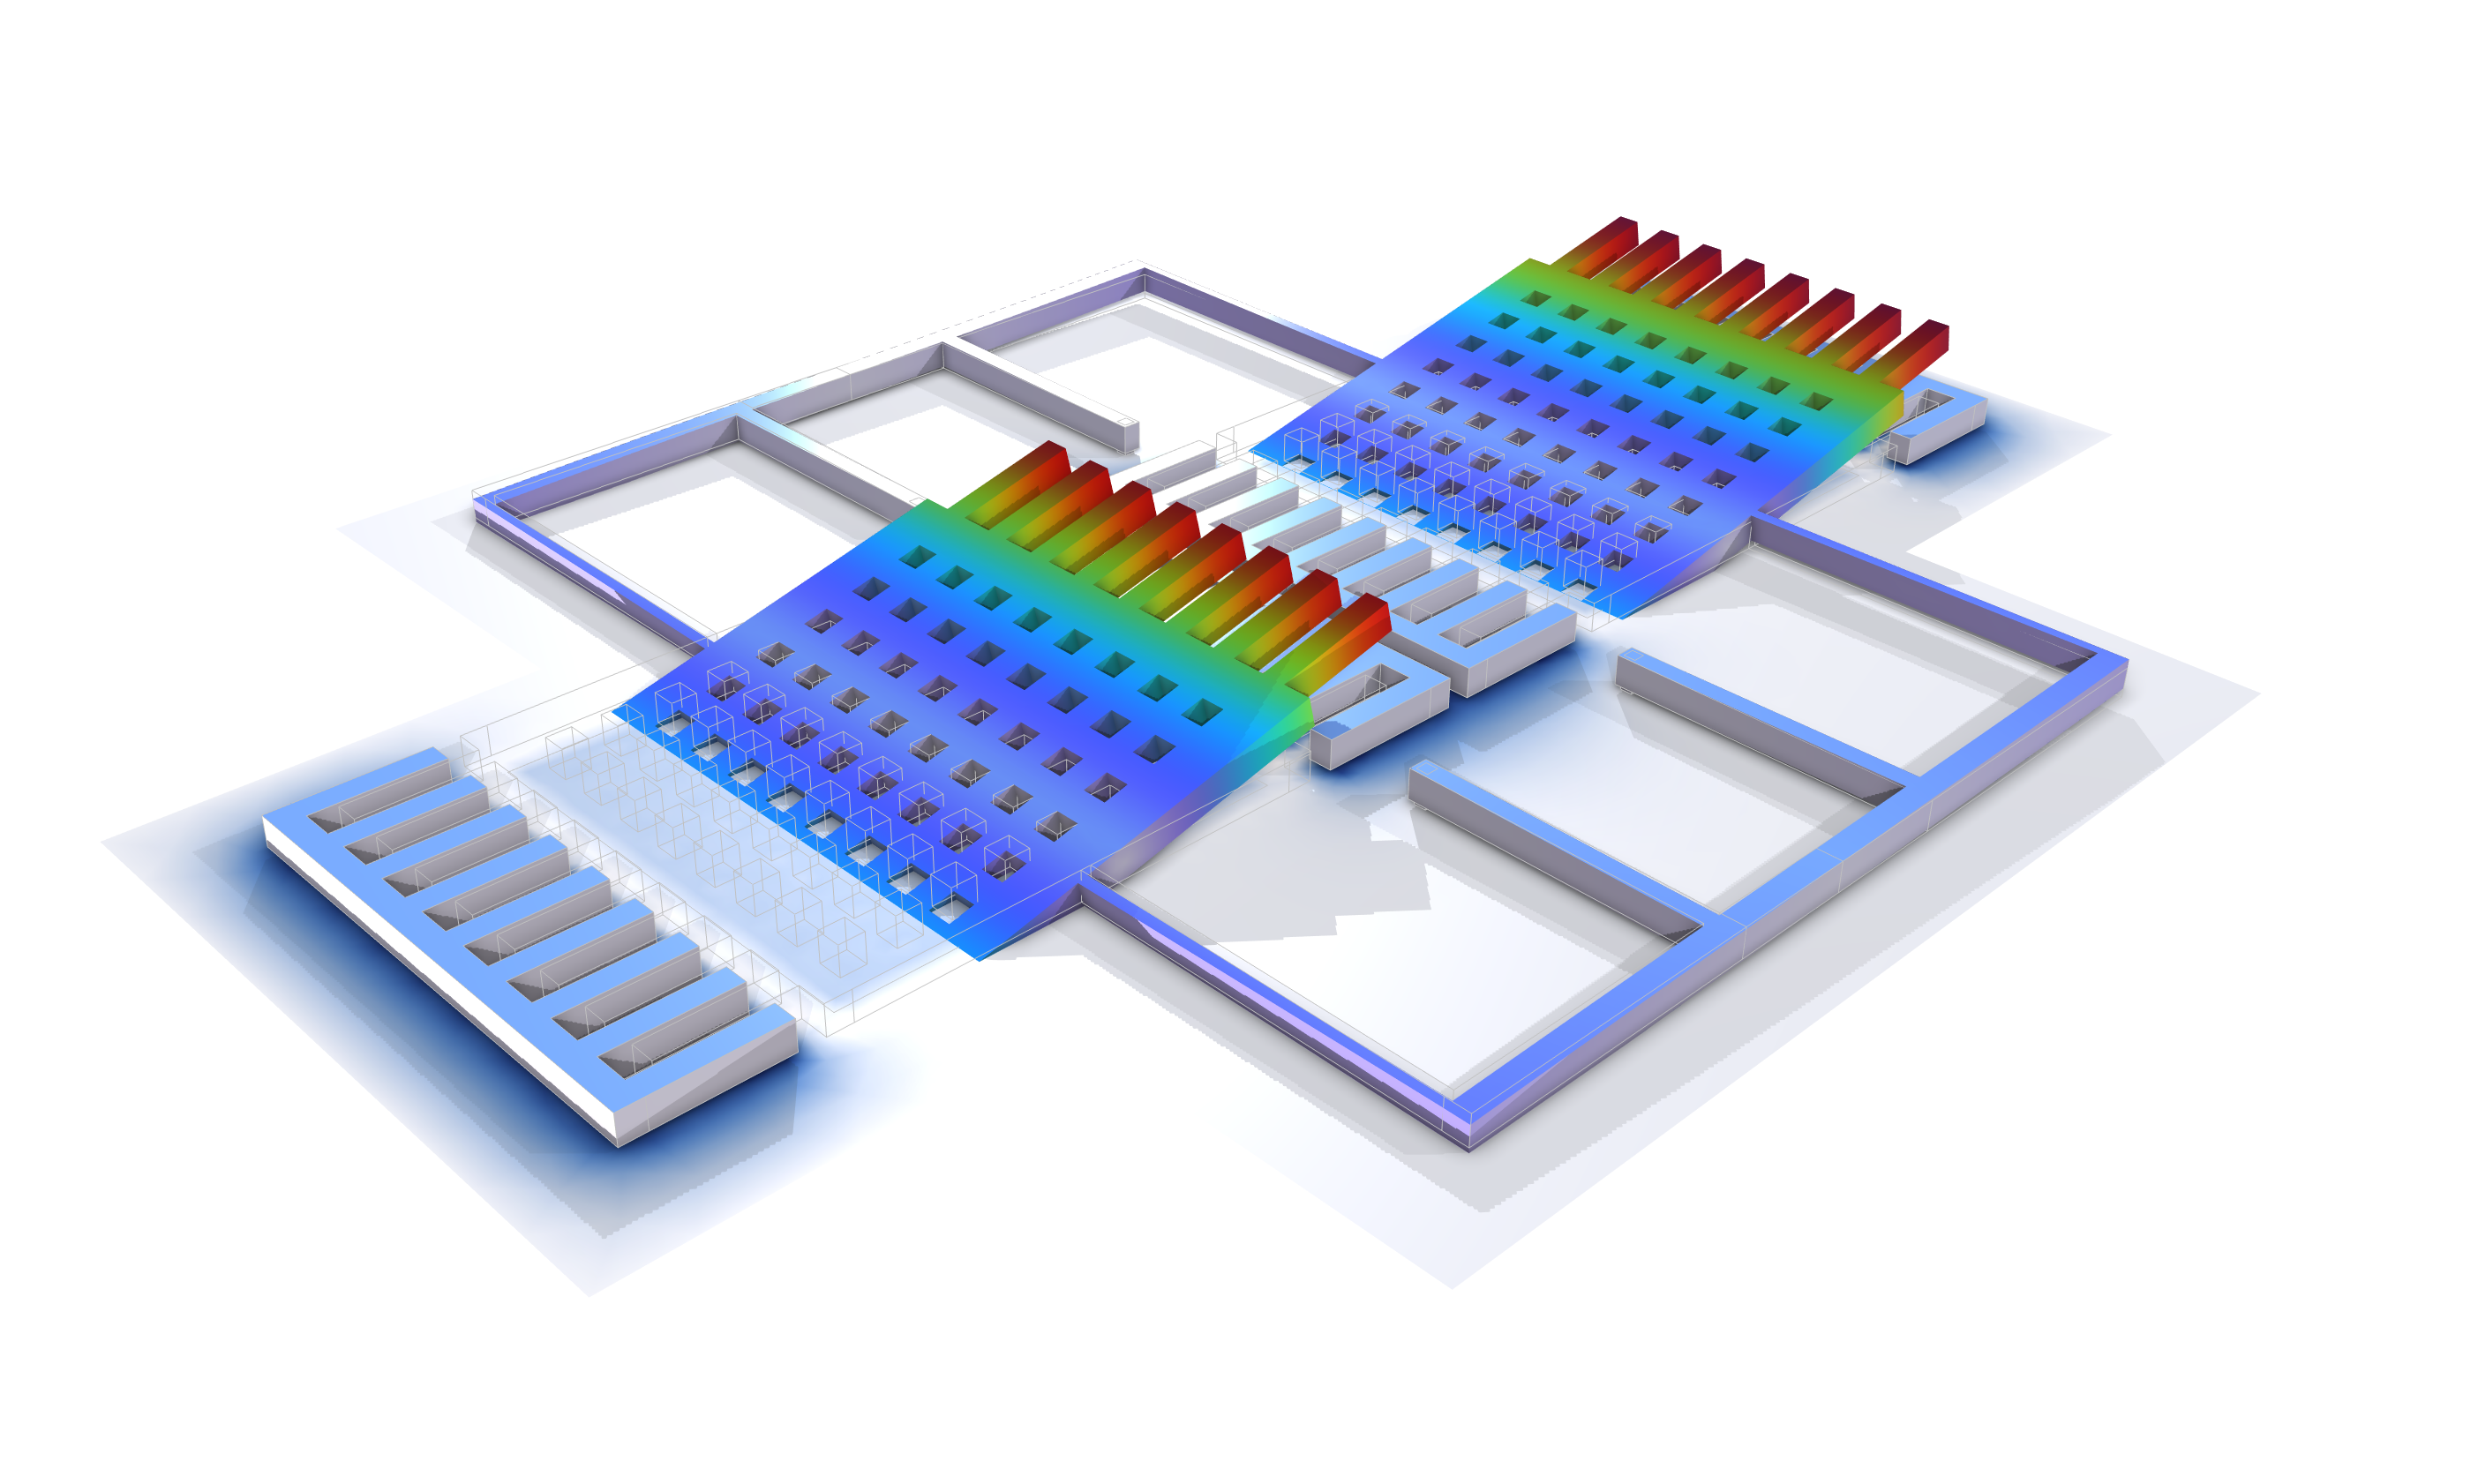 A MEMS gyroscope can be modeled as a vibratory rate gyroscope, where Coriolis forces couple a driven vibration mode to a sensing mode. Although the geometry of the IMU used in the Trionda is proprietary and thus its gyroscopes can’t be recreated exactly for simulation, COMSOL Multiphysics® models of comb-drive tuning fork gyroscopes illustrate this principle.
In addition to the IMU, the electronics package inside the Trionda also contains a local positioning transmitter that sends timing and positioning data to stadium anchors, an ultra-wideband (UWB) RF antenna for communication with the anchor infrastructure, and a battery. Like the IMU, the RF electronics and batteries can be analyzed using COMSOL Multiphysics®.
The IMU and positioning system can be used by the VAR team for more than just determining whether the ball was touched in a potential handball situation, like the Šeško goal I mentioned earlier. It can also be used to determine the exact moment when the ball is touched during a pass, making it possible to determine whether the receiving player was offside at the exact moment of the pass. The high sampling frequency allows the system to distinguish between successive touches during rebounds and deflections, which can be important in crowded situations inside the penalty area. Additionally, the positioning system can determine where the ball is relative to the goal line (presumably in combination with image processing).
The gyroscopes can also be used to measure the angular velocity and spin axis of the ball in real time during flight, making it possible to analyze curl, Magnus effect trajectories, and low-spin “knuckleball” shots in far greater detail than before.
It would be even nicer if we, in front of our TV screens, could also see statistics for the hardest shots and the shots with the most curl during a game!
The Sensors on the Vests
The vests that the players wear under their jerseys contain even more sensors and electronics than the ball. While the IMU inside the ball is designed to measure and withstand hard shots and rapidly spinning balls, the IMUs in the players’ vests are optimized for long-duration motion tracking and sensing during running and changes in direction.
If you look closely at the players during a game, you may notice a small protrusion under their shirts between their shoulder blades. That little hump is the pod of the vest, where most of the sensors and electronics are located. The ECG electrodes that measure heart rate and heart rate variability are the only sensing devices placed outside the pod. They are positioned in the front lower part of the vest.
You can often see the vest after games, when the players exchange shirts.
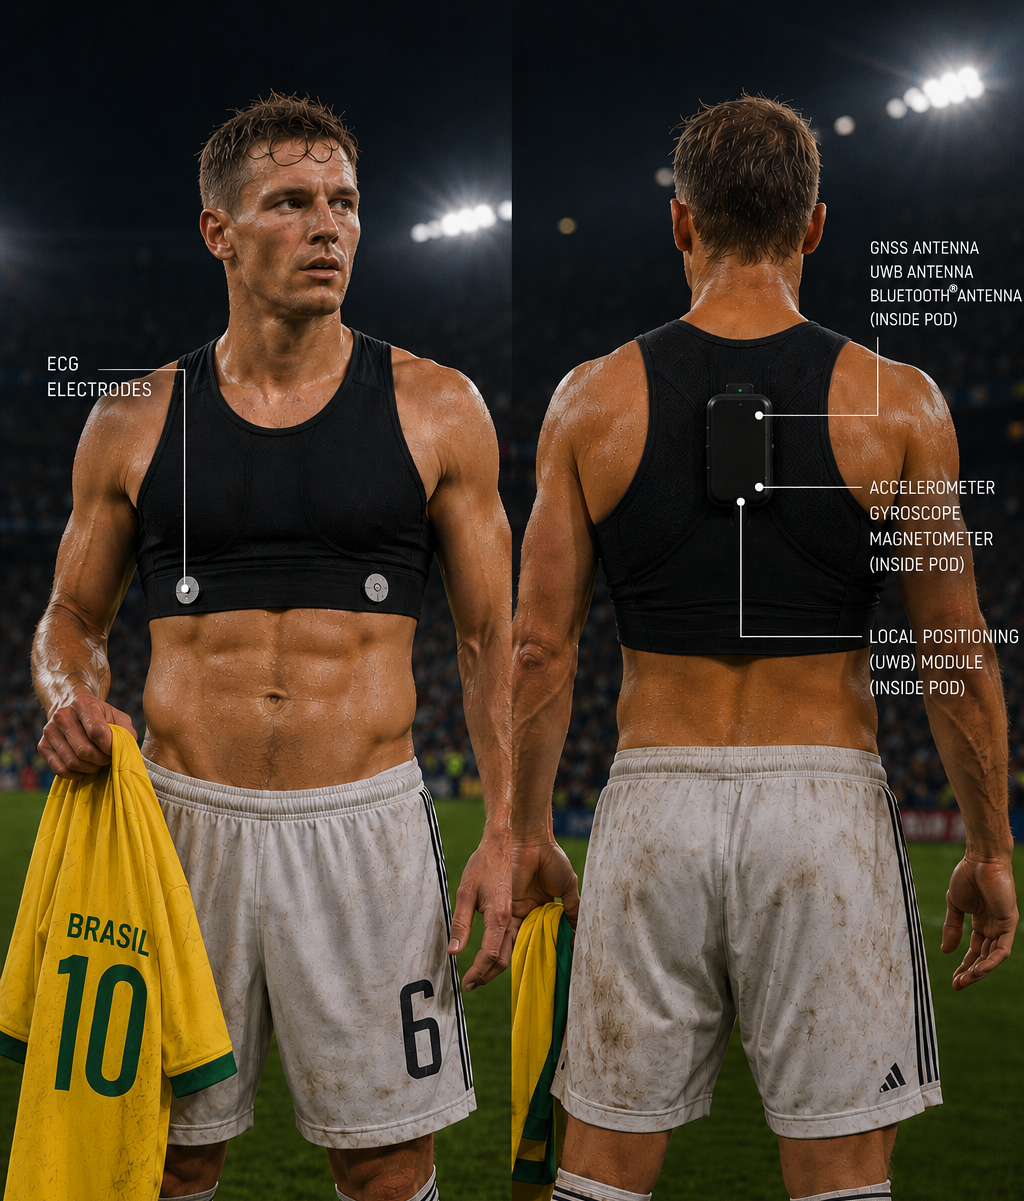
Schematic image of the sensors in the vest and in the pod. In the real vest, the pod is hidden inside a pocket, and the ECG electrodes are embedded inside the vest and thus cannot be seen (unless the vest is turned inside out). This image was created with ChatGPT™.
In addition to the IMU with accelerometers and gyroscopes measuring acceleration and angular velocity in all three directions, the pod also contains a global navigation satellite system (GNSS) receiver together with a local positioning system, similar to the one used in the ball. It also contains a triaxial magnetometer that measures the magnetic field direction for orientation correction, as well as antennas, RF transmitters, microcontrollers, batteries, and other electronic components.
You can imagine the importance of the thermal management design of the pod, with all of these electronics packed inside. The vest itself probably impedes cooling of the player, and if the pod is not well designed, it may even contribute as a nasty heat source.
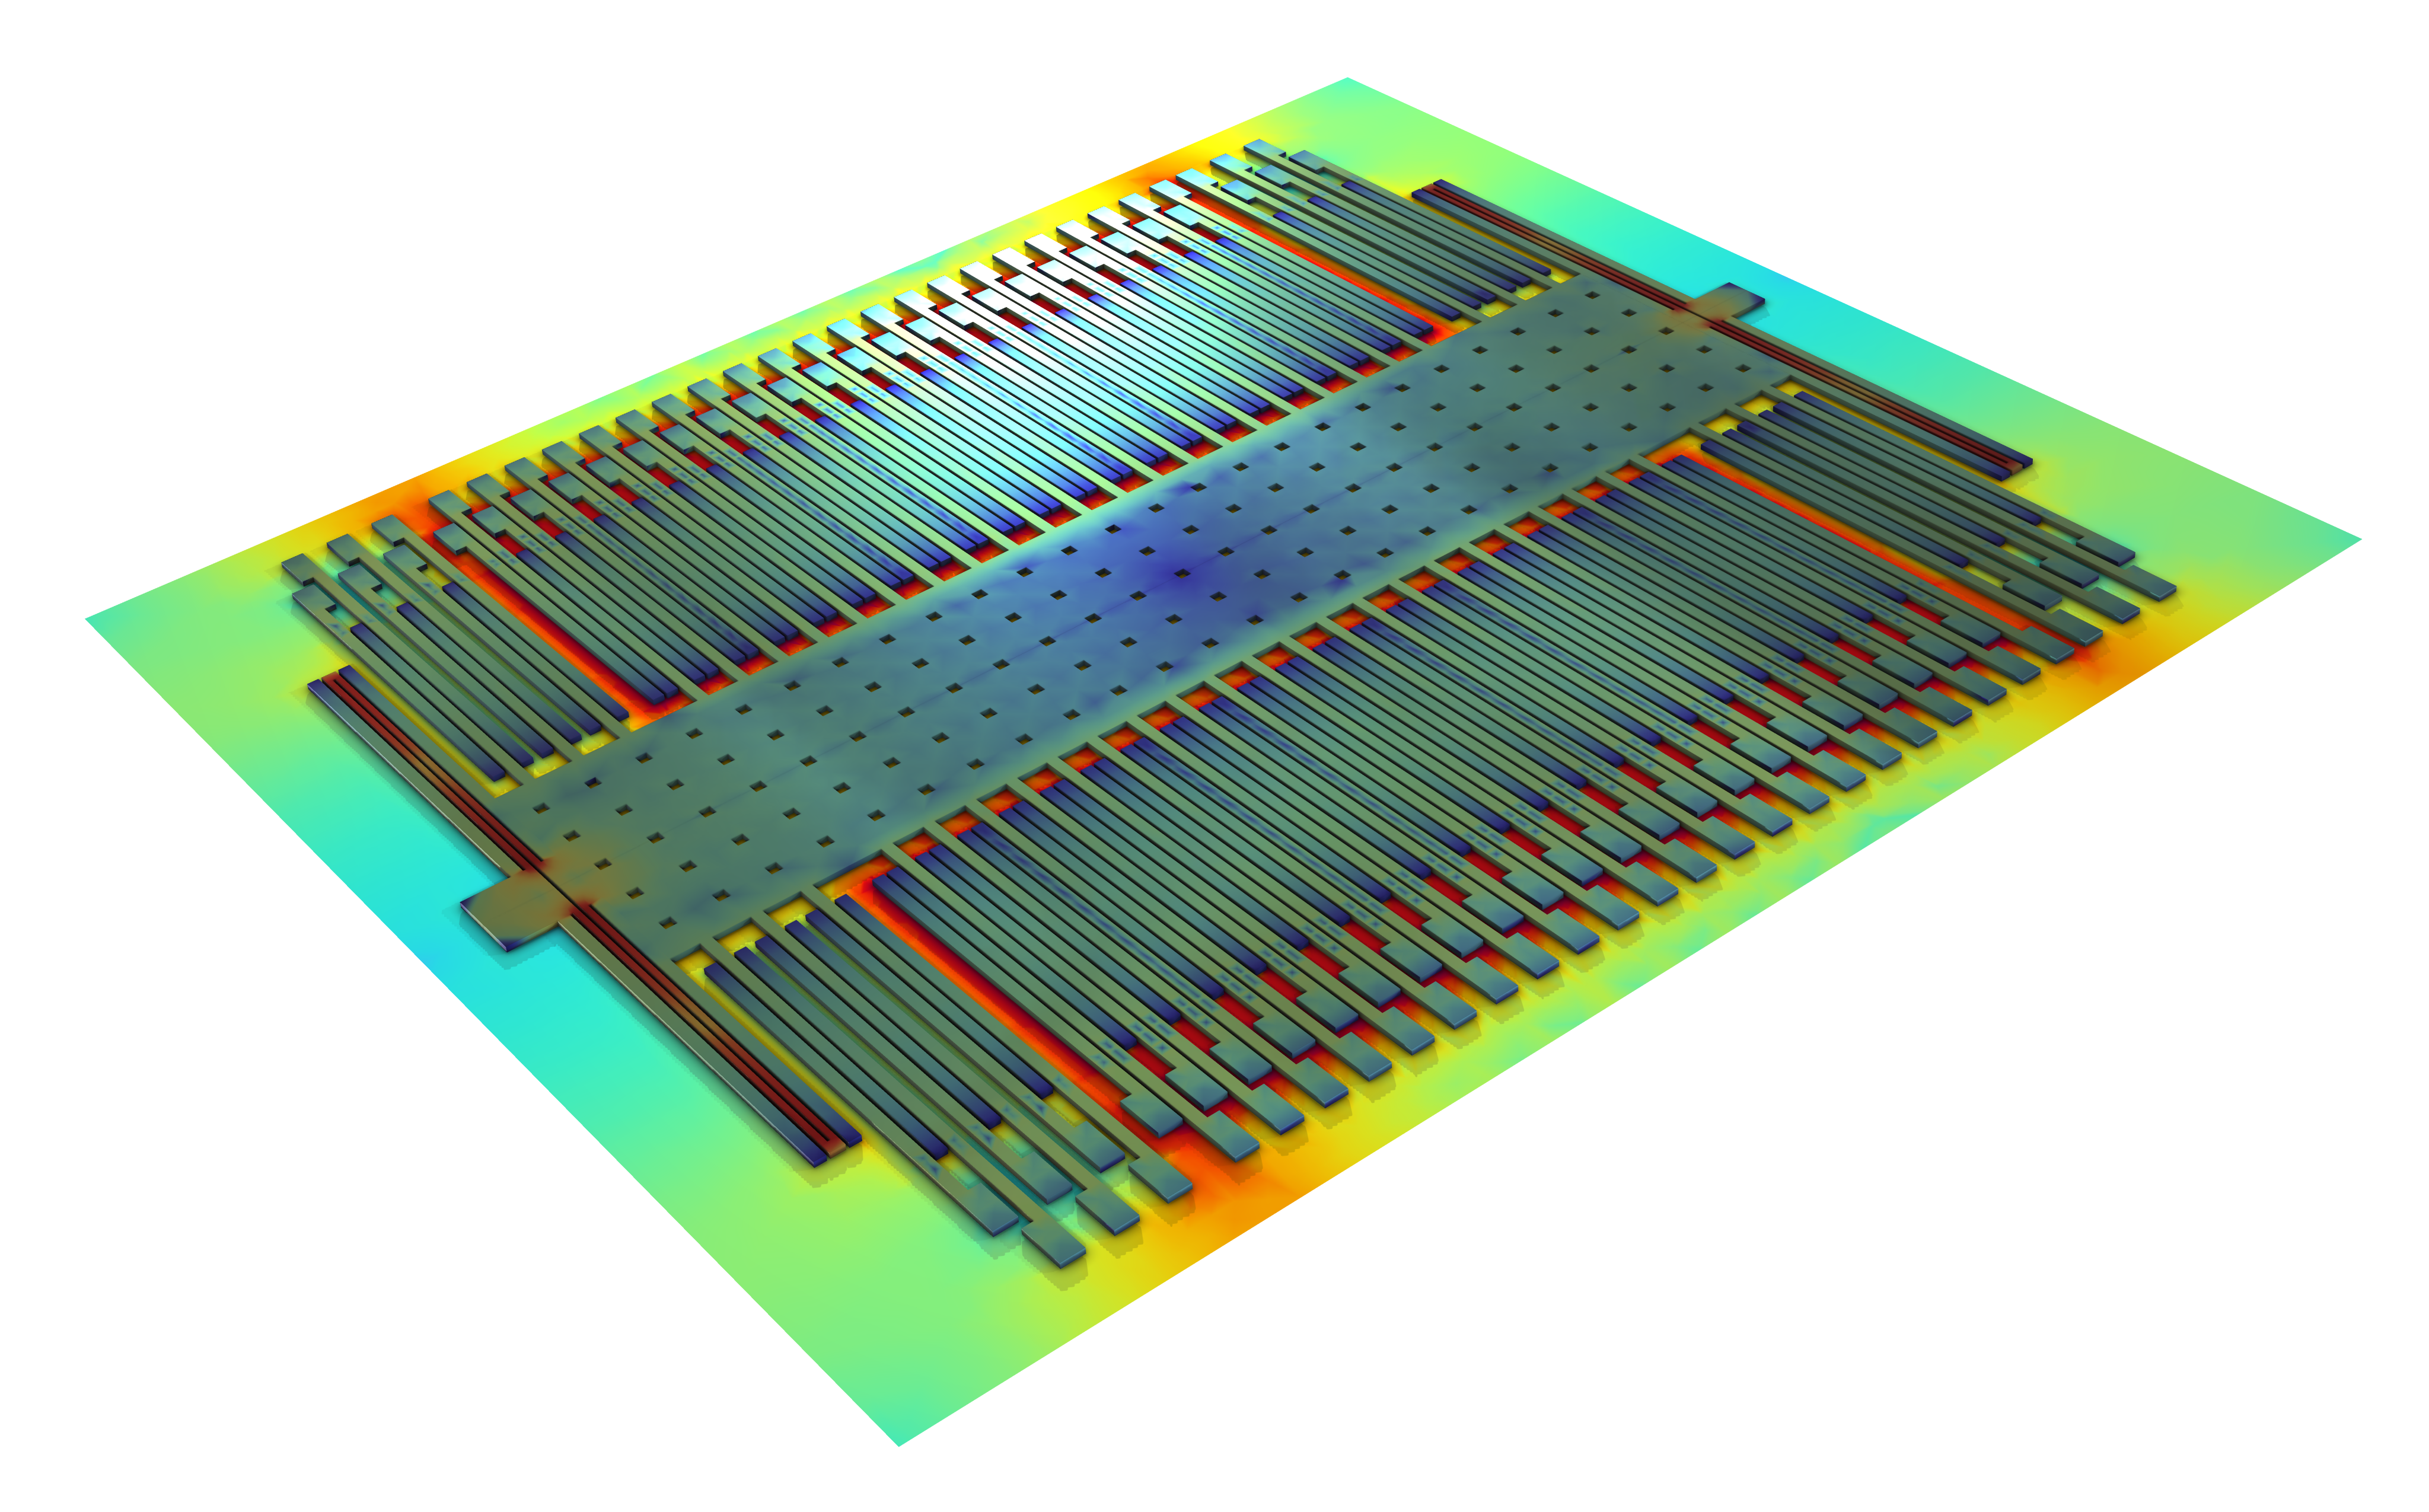 A COMSOL Multiphysics® simulation of a capacitively actuated surface micromachined accelerometer, which is typically used in consumer products.
Nonetheless, the data extracted from the vest is valuable for improving the players’ performance over time. The schematic below shows the output from a fictional player’s vest, which coaching staff can view live during the game and analyze afterward.
If a player is, for example, taking fewer sprints with lower acceleration and showing other signs of fatigue, the coach may decide to substitute the player. After the game, the player and coaches may analyze how the player moved across the pitch using the heat map and may also make tactical adjustments.
The data can also reinforce tactics that work well. For example, if the heat map shows good possession statistics and a high number of offensively successful crosses from one side of the pitch (“field”) for a central midfielder, the coaches may decide that the player should prioritize attacks on this side while remaining more central when defending. This might be the left side for a left-footed player, for example.
Since the vests were introduced, their statistics have been kept internal to the team and not shown on TV — much to my frustration. Sometimes, when a player is substituted, we get to see the total distance they covered, but that is usually all. The ball and vest data are not normally processed together either. Statistics such as player contact with the ball, expected goals, and shots on goal are usually obtained through image processing independently of the vest and ball data.
Imagine being able to see the full statistics from the ball and vests live during the game! Being able to visualize the most successful and least successful parts of a player’s game in real time, and not just as a table shown after the match or during halftime, would be fascinating.
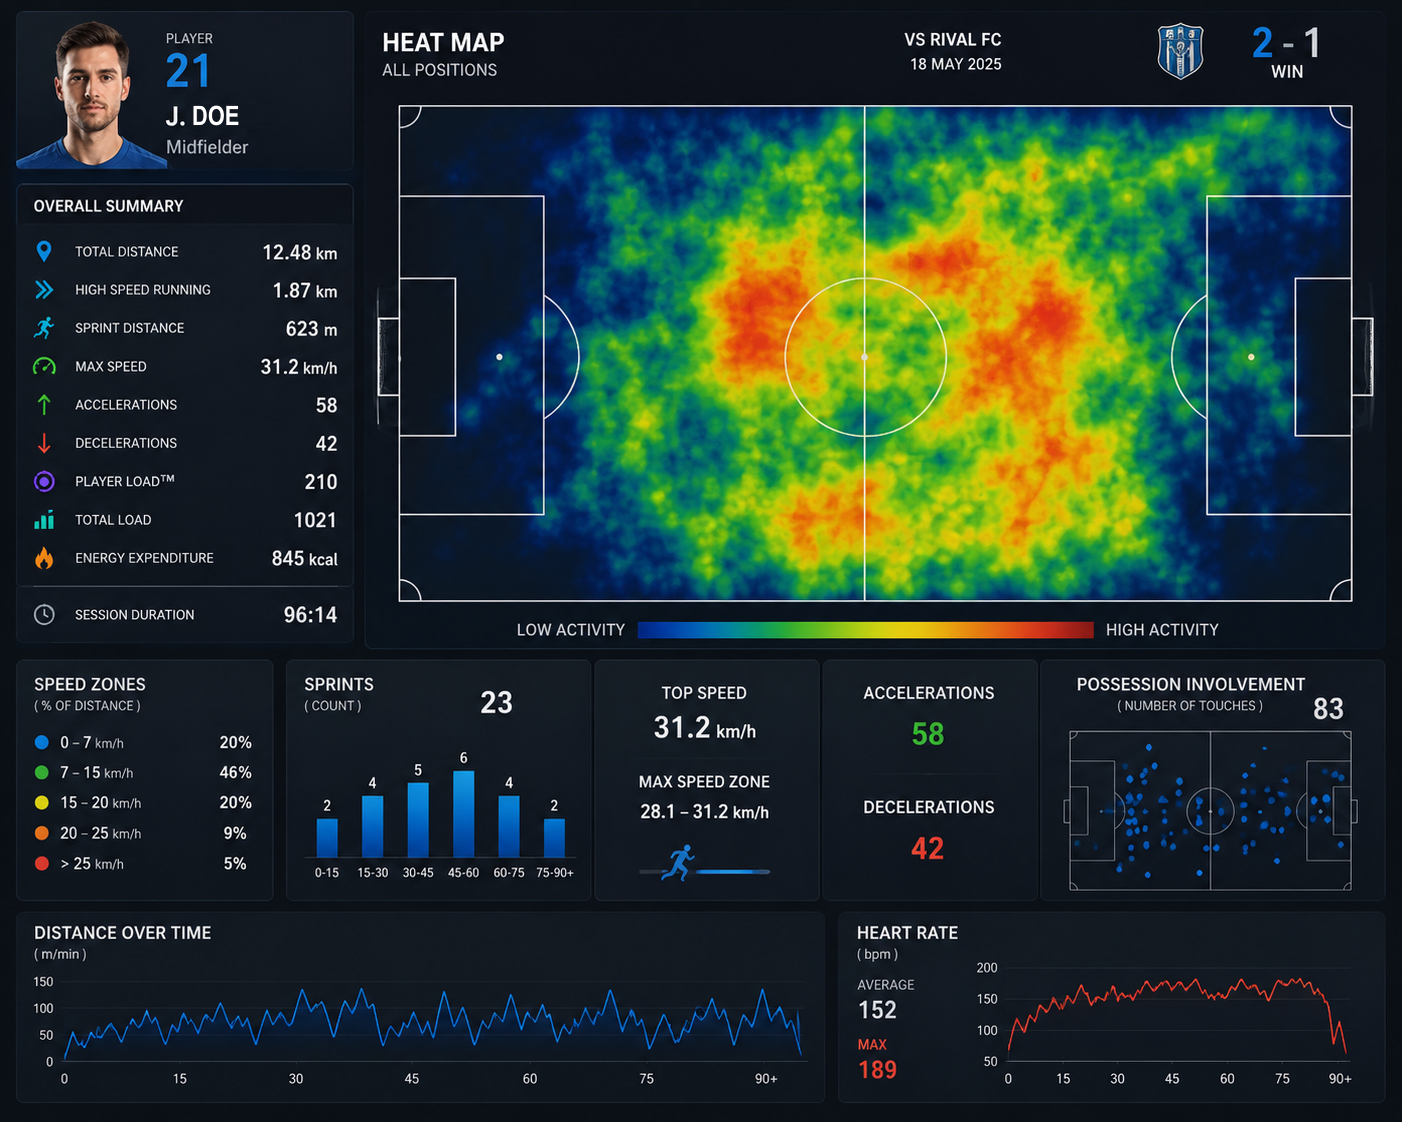 Schematic view of the “UI” presenting the data from the vest of player “John Doe”. The heat map reveals that the player is an attacking central midfielder, since there are few defensive high-speed sprints. The heat map almost always shows the attacking direction from left to right. This image was created with ChatGPT.
The Crowd
So far, I’ve talked about the sensors inside the ball, how they make the VAR team’s job easier, and how they can also make the game more interesting for us viewers.
While this latest tech is changing the game for viewers, one aspect of football that always has and always will make it so exciting to watch is the crowd. And the best way to experience football is, of course, live at the stadium.
Some of the 2026 World Cup matches will be played at the iconic Estadio Azteca (officially “Estadio Banorte”) in Mexico City, the stadium where Carlos Alberto scored in the 1970 World Cup final with a fantastic thunderous instep shot from a pass by Pelé and where Diego Maradona scored the Goal of the Century (“el barrilete cósmico”) during the 1986 World Cup.
Estadio Azteca has been extensively renovated for the World Cup (and temporarily renamed “Mexico City Stadium” by FIFA). Among other things, a completely new sound system has been installed to improve the live experience. For fun and to help imagine how it sounds in the stadium, the COMSOL team simulated the acoustic wave propagation of one of the system’s speaker arrays (below); stay tuned for the third blog post in this World Cup series, where I’ll share more simulation results as I sound off on the acoustics of the beautiful game.
Simulation of the acoustic wave propagation from one of the speaker arrays hanging from the roof in the newly renovated Estadio Banorte (Estadio Azteca). The full sound pressure distribution can be obtained by superposition of the sound fields from roughly 70 distributed speaker arrays suspended from the roof structure and placed throughout the stadium.
Until then, let’s continue rooting for our favorite teams in what will hopefully be the best World Cup ever!
For the Love of the Game (Only!)
Although the models and simulations presented here are state-of-the-art, they were created just for fun. A serious scientific study would investigate the involved parameters in much greater detail. For example, the geometry of Estadio Banorte would need to be modeled in far greater detail and the simulation results validated against measurements.
These investigations were performed independently of Adidas, Kinexon, and TDK, and we do not claim any cooperation with any of these organizations.
Adidas and Trionda are registered trademarks of adidas AG.
The Bluetooth word mark is a registered trademark owned by Bluetooth SIG, Inc.
ChatGPT is a trademark of OpenAI OpCo, LLC.
FIFA World Cup is a registered trademark of the Fédération Internationale de Football Association.
InvenSense and MotionTracking are registered trademarks of InvenSense, Inc.
Kinexon is a registered trademark of Kinexon GmbH.
Nike is a registered trademark of Nike, Inc.
TDK is a registered trademark of TDK Kabushiki Kaisha.
COMSOL AB and its subsidiaries and products are not affiliated with, endorsed, by, sponsored by, or supported by any of the foregoing trademark owners.


Comments (0)