LiveLink™ for MATLAB®
Improved Wrapper Function: mphplot
For a better plotting experience with LiveLink™ for MATLAB®, the wrapper function mphplot has been enhanced with more accurate colors, line styles, and symbols. A new option, normals, instructs mphplot to use normals when rendering surfaces in 3D. Use this option for more visually appealing arrow plots and plots with lighting.
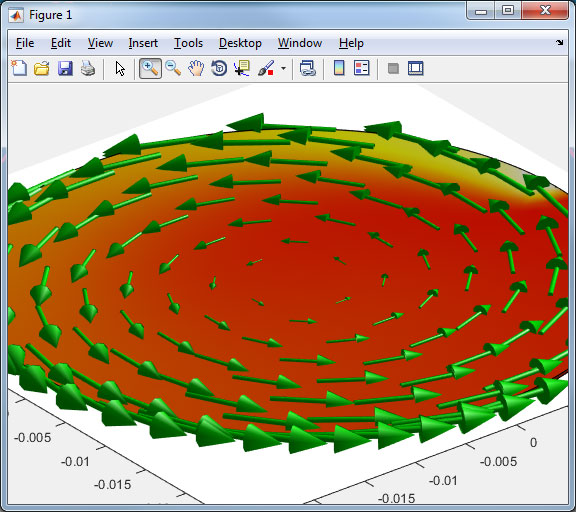 A plot from the Laser Heating of a Silicon Wafer tutorial model showing the rotation of the wafer using arrows and the temperature as a colored surface.
Improved Wrapper Function: mphgetexpressions
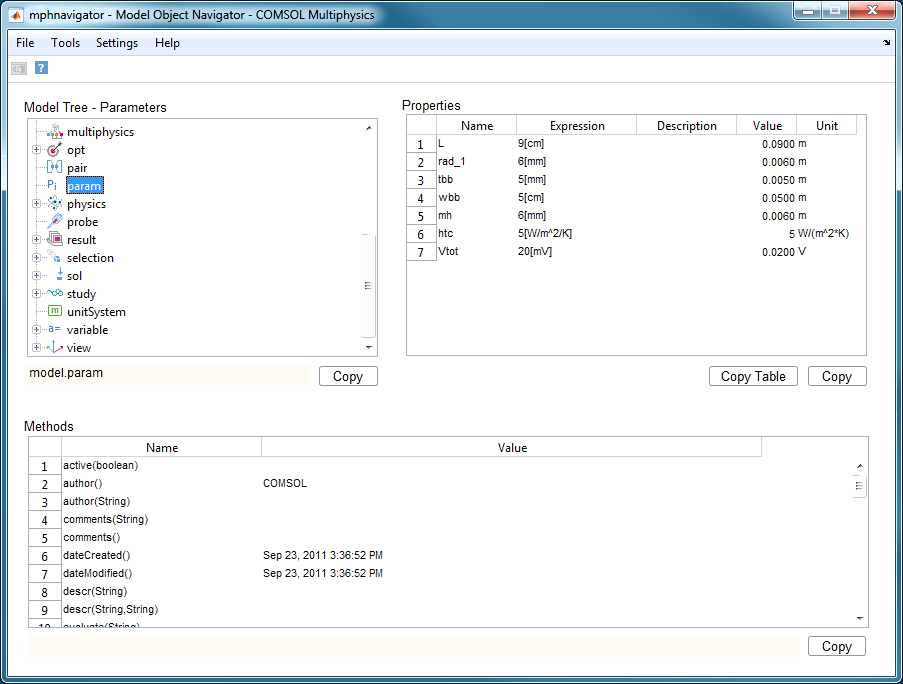
The wrapper function mphgetexpressions can now return the value and unit of the evaluated expressions using the unit system of the model.
 The MATLAB® command line showing the name, expression, description, value, and unit for the parameters from a simulation.