Results and Visualization Updates
Animated Camera Transitions
In the Graphics window, camera transitions are now animated by default, providing smooth movements when changing views — such as when transitioning from a default 3D view to an xy-plane view. Additionally, actions that alter the view, such as zooming or changing to a predefined view, are also animated. This enhancement is particularly useful when working with complex geometries, as animated view transitions provide a better sense of orientation and make navigating a model more intuitive. This behavior can be customized by adjusting the settings within the Graphics > Interaction > Camera page in the Preferences window.
Preferences for Units
The new Preferred Units configuration enables default units to be set for each physical quantity, ensuring that data is displayed in the most natural way for an analysis and that values are presented on a familiar and intuitive scale. This configuration also supports multiphysics scenarios, including, for example, using MPa for stress while simultaneously using psi for fluid pressure. View this feature in the Bracket — Structural Mechanics Tutorials and Cycle Counting in Fatigue Analysis — Benchmark tutorial models.
Beam and Pipe Datasets
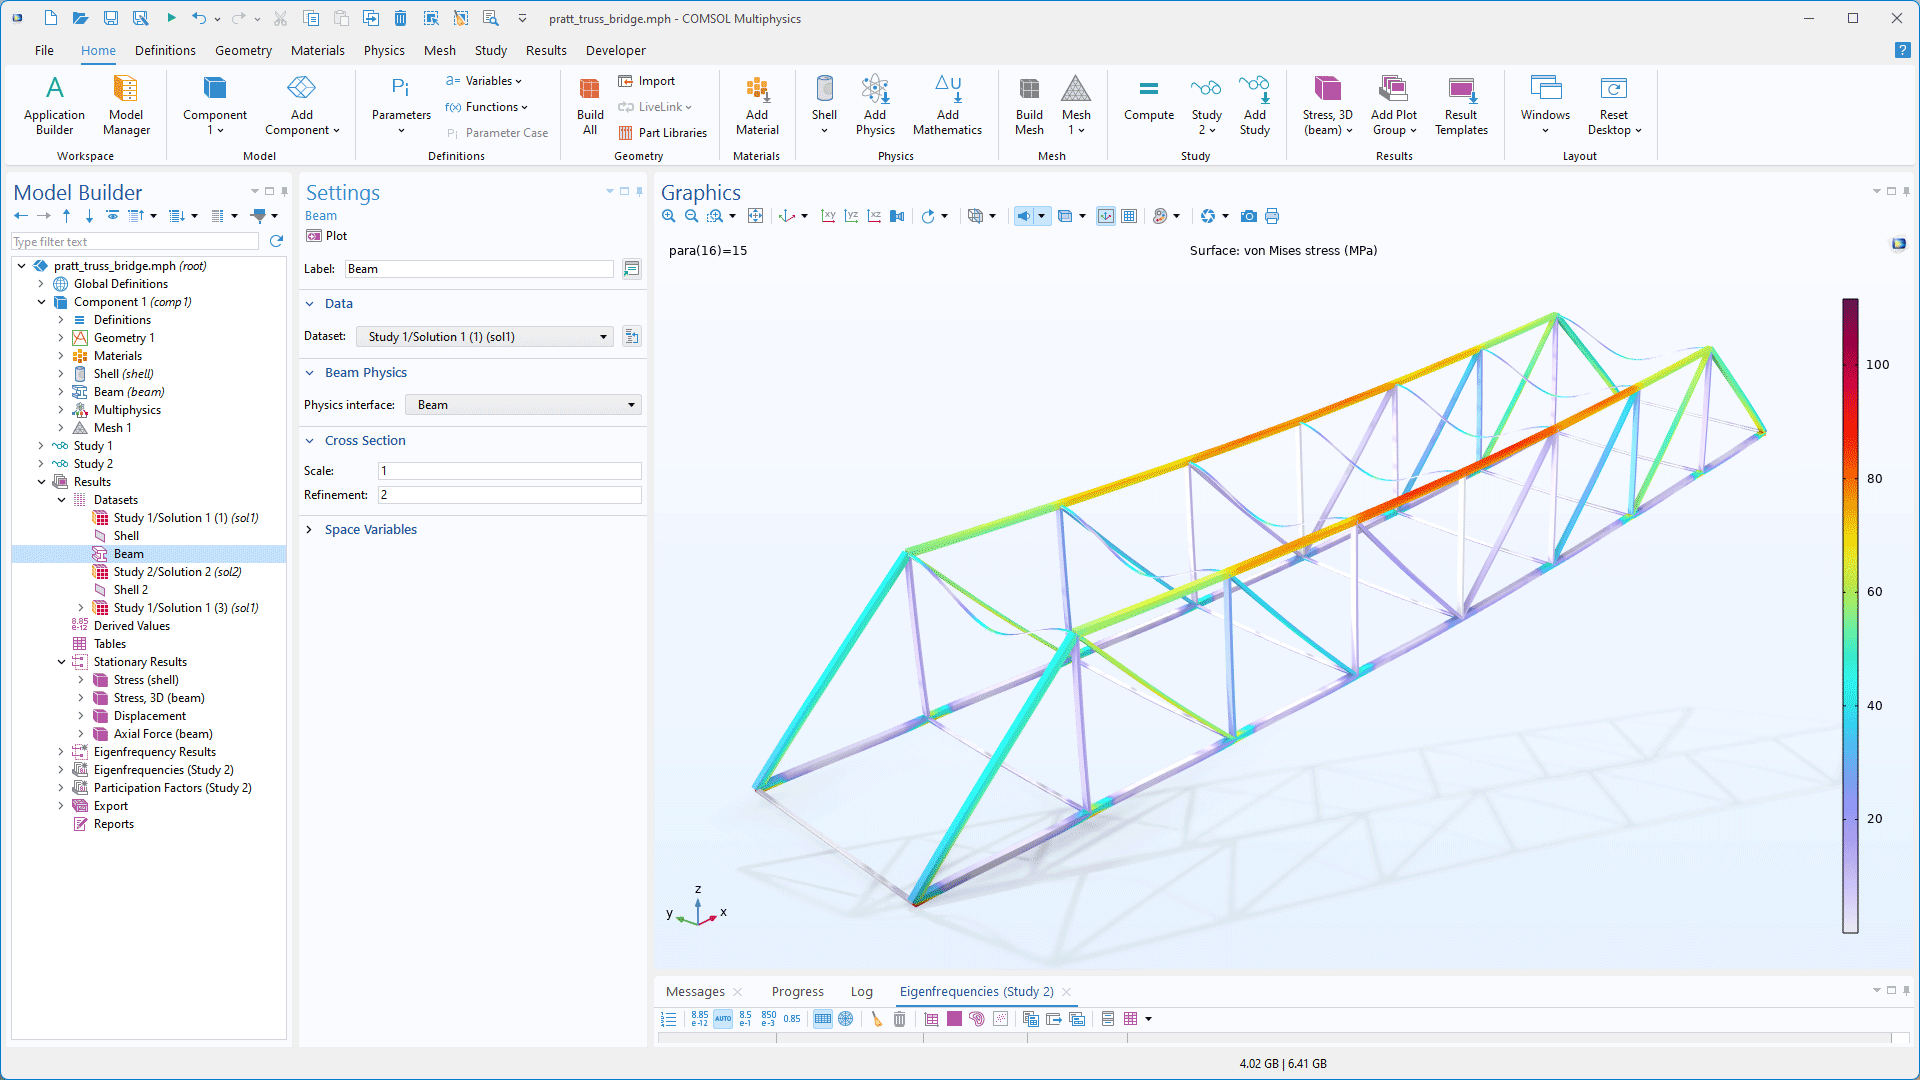
There are new Beam and Pipe datasets available for visualizing beams and pipes in a model, providing more accurate 3D shape visualization. Additionally, these datasets enable visualization for the variation of expressions along beams or pipes. This new capability can be seen in the Pratt Truss Bridge tutorial model.
Create Annotations Interactively
With the new Marker Point graphics interaction feature, you can add annotation markers that display field values to 2D and 3D plots by clicking points directly in the Graphics window. The marker point coordinates are stored and can be edited in the Marker settings window. The marker point coordinates, along with their corresponding field values, are additionally displayed in a separate Marker Points table. Adding annotation markers can also be performed noninteractively by importing a text file with coordinates.
Color Legend Titles
In addition to specifying titles for plot groups and plots, it is now possible to assign titles to color legends. This enables a clearer and more direct association between the title and the data being visualized. This feature can be viewed in the Radial Pump with Mixing Planes and Analysis of NOx and Ammonia Conversion Kinetics in a Dual-Bed Plug-Flow Reactor tutorial models.
Point Plots of the Values in Node Points or Gauss Points
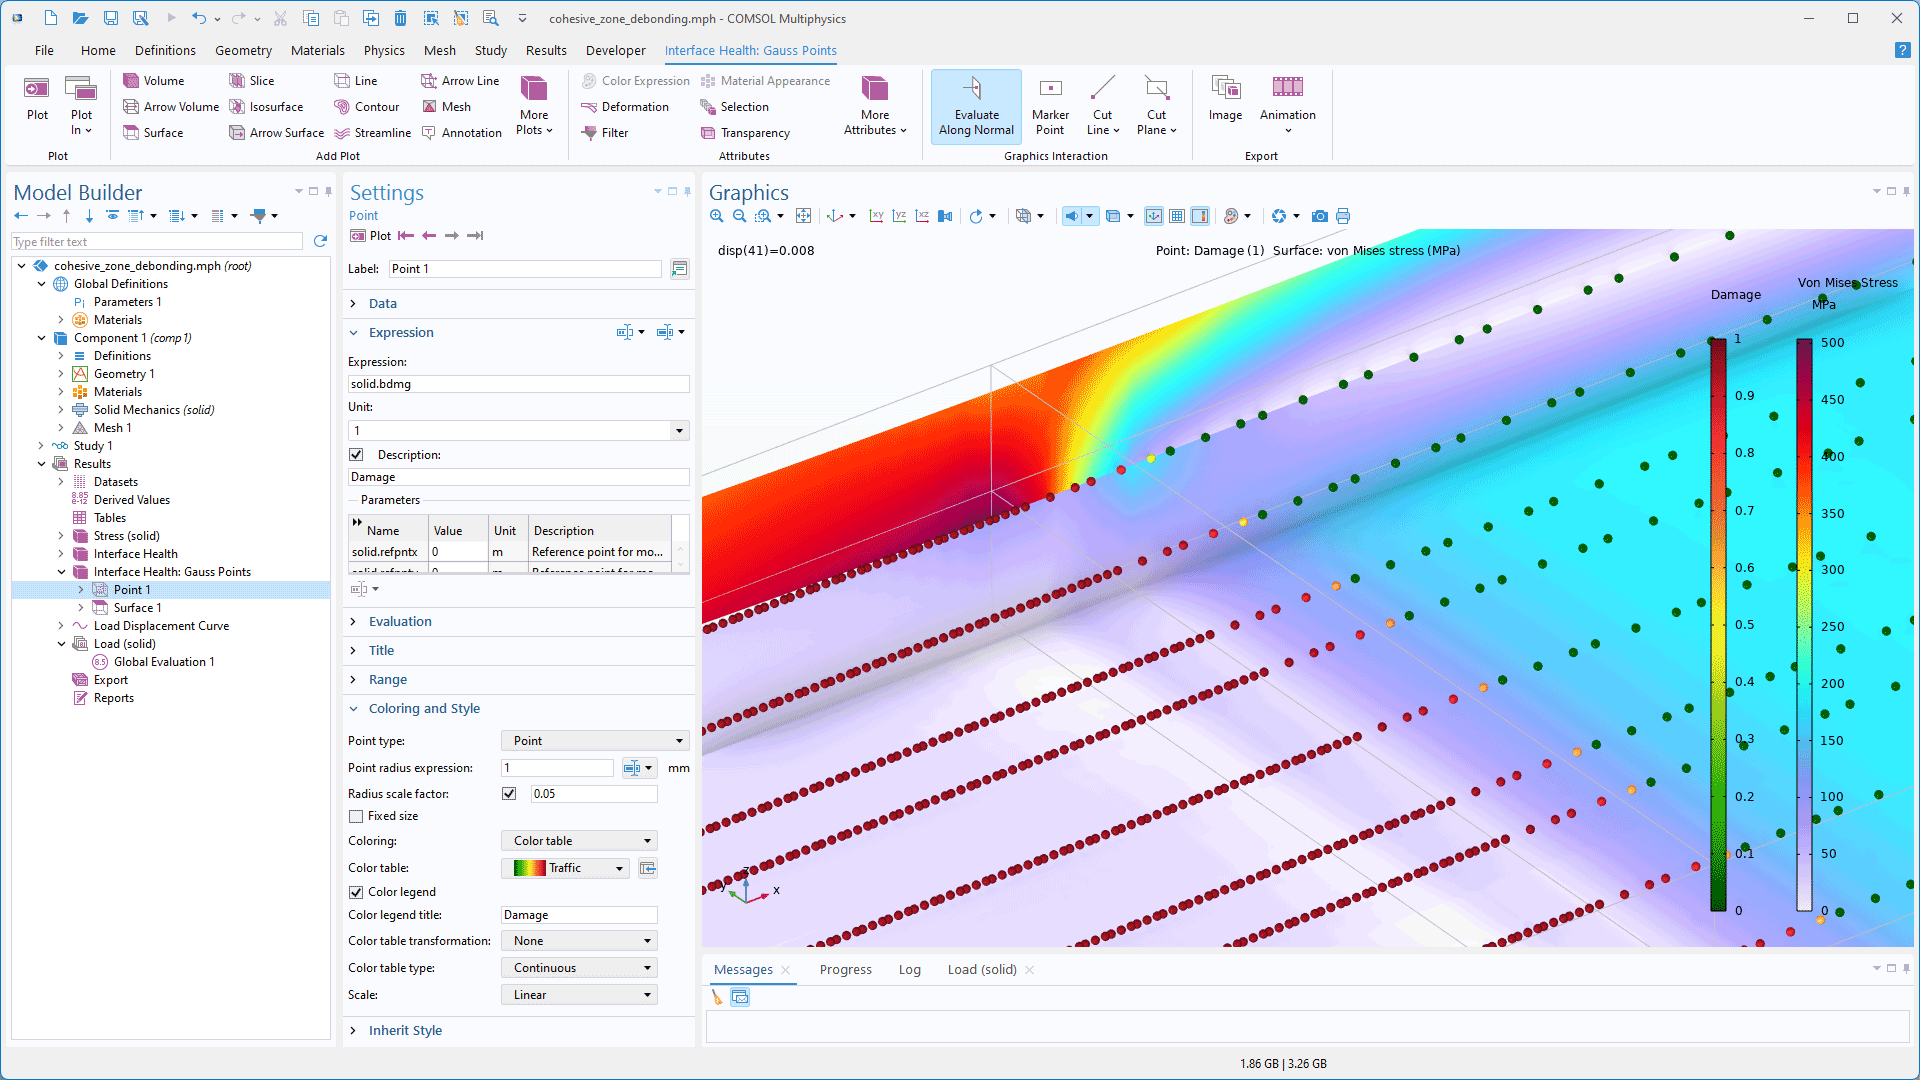
2D and 3D Point plots now support the option to display values at node points or Gauss points over domains, surfaces, or edges. In some cases, using this option can provide more detailed insight into a model's behavior compared to using surface, volume, or slice plots. This new functionality is demonstrated in the Mixed-Mode Debonding of a Laminated Composite tutorial model.

Miscellaneous Updates and Additions
- The Add Predefined Plot window in previous versions of the COMSOL Desktop® has been renamed to Result Templates to better reflect its expanded functionality. Now, in addition to setting up plots, templates can be created to include evaluation groups and derived values.
- All Export features can now run automatically after solving the model by selecting the Run all exports after solving checkbox in the Settings window of the main Results node.
- A new Last option is available for time selection of transient solutions in 2D and 3D plots.
- A new Unwrap phase checkbox is available for 1D Global and Point Graph plots for data with angular units. When selected, the plot displays phase values without discontinuous jumps.
- Row numbers can now be displayed in tables by clicking the new Show Row Numbers button in the toolbar of the Table windows.
- The
evaloperator in Annotation plots has been improved. It now supports formats of type%%[flags][width][.precision]. Allowed types ared,f,e,E,g, andG. For example,eval(pi*1e10,,%%+.3e)gives the output+3.142e+10, showing the number in scientific format, with three decimal values and the sign of the number shown.
- The
- For models that include a phase, the Solution at angle (phase) list in plot groups now includes a Custom per plot option. This option adds individual Solution at angle (phase) lists for each plot within the group, making it possible to specify the phase separately for each plot.
- When the deformation or movement of materials with surface irregularities, such as concrete or scratched metals, is rendered, the irregularities now correctly follow the deformation of the geometry or move with it.
- A new collection of color tables inspired by natural themes is now available.


