11 light-years away from our solar system, an exoplanet called Ross 128 b orbits a red dwarf star. This planet has the potential to support life and is the second-closest temperate planet discovered, with a surface temperature that might be similar to Earth’s. Astronomers detected Ross 128 b by using data from an échelle spectrograph called HARPS. To further advance the search for Earth-mass exoplanets, we can improve the sensitivity of échelle spectrographs using the COMSOL Multiphysics® software.
Exploring Outer Space with Échelle Spectrographs
In the search for planets outside our solar system, astronomers rely on a wide variety of tools, one of which is the échelle spectrograph. This device consists of mirrors, gratings, and lenses that separate polychromatic light into a highly dispersed spectrum. Échelle spectrographs boast a high resolving power and can capture spectra over a large wavelength. Thus, 2D échelle spectral formats enable very large spectral grasps. The visible light instruments can even cover the full visible spectrum in a single exposure.

An example of a 2D échelle spectral format. Here, the primary (or échelle) dispersion moves from left to right and the cross dispersion moves from bottom to top.
Échelle spectrographs can be used for precision Doppler velocimetry, the high-resolution analysis of stellar atmospheres, and high-throughput Raman spectroscopy. For instance, the échelle spectrograph HARPS helps astronomers to locate new exoplanets — such as the Earth-like Ross 128 b — by detecting tiny wobbles in the motion of the stars, which betray the presence of an orbiting planet.
Moving forward, a successor of HARPS with increased precision called ESPRESSO may further enhance our ability to search for new planets. Other teams, such as those from NASA and those working on the Giant Magellan Telescope (GMT), are also helping us move toward the next generation of instruments for exoplanet discovery.


The HARPS spectrograph (left) and an artistic interpretation of Ross 128 b (right). Images by ESO (left) and ESO/M. Kornmesser (right). Licensed under CC BY-SA 2.0, via the ESO copyright guidelines.
To evaluate the design of échelle spectrographs and aid in their continued advancement, we can model these devices using COMSOL Multiphysics and the add-on Ray Optics Module.
Using Ray Tracing Simulation to Study a White Pupil Échelle Spectrograph
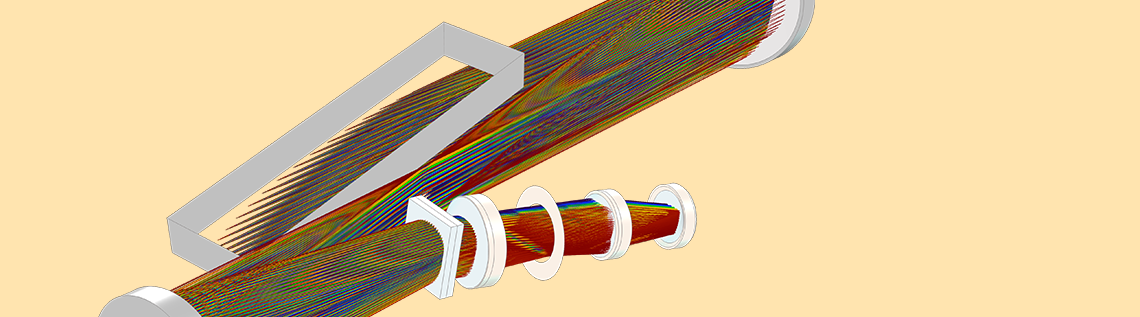
In this example, a “white pupil” version of an échelle spectrograph is focused with a Petzval lens. The model includes two grating components:
- An échelle grating in high order
- A cross-disperser grating that has an orthogonal direction of dispersion
This design can generate 2D spot arrays for various échelle orders and wavelengths.
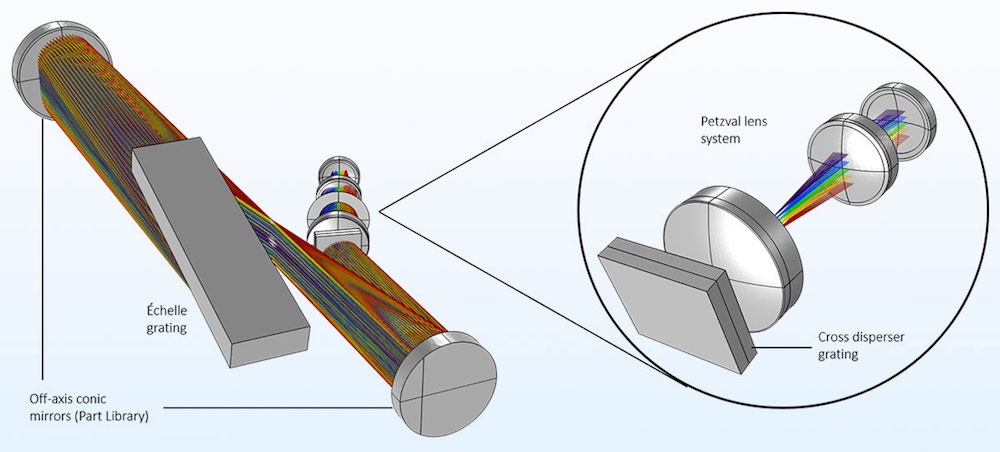
A depiction of a white pupil échelle spectrograph and a magnified view of a Petzval lens system, which shows only the axial rays for the different wavelengths.
To streamline the process of building the complex model geometry, we use ready-made parts available in the Part Library. We further simplify the model creation process by building the spectrograph geometry separately. To do this, we split the spectrograph parameters (which can be given a numeric value or expression) into two categories:
- Parameters for creating the geometry
- Parameters for setting up and completing the ray tracing simulation
Since the model geometry is fully parameterized, we can adjust all of the main physical and geometric properties with the Parameters node.
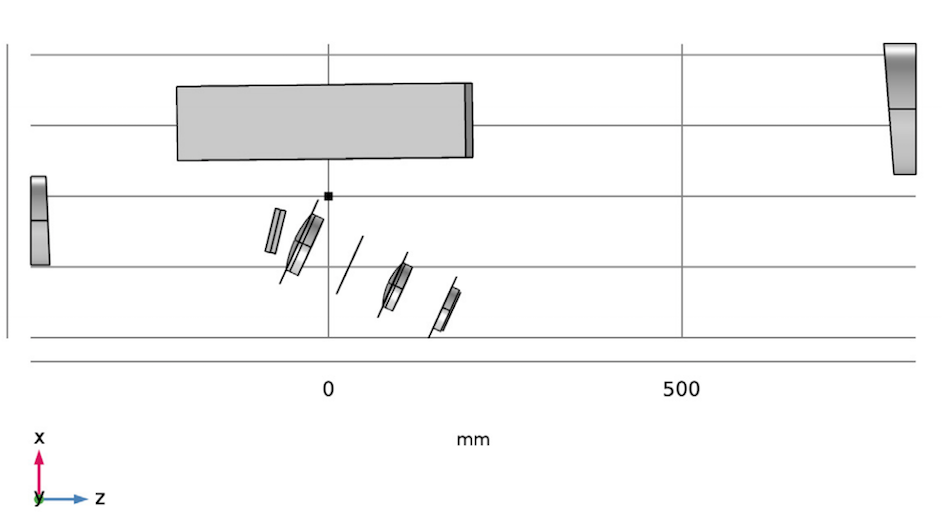
The full geometry sequence for the échelle spectrograph model.
We then perform a parametric sweep across multiple orders, each with several wavelengths. Here, we run a ray trace over 5 échelle orders with 11 wavelengths per order, but this analysis can be extended to include as many wavelengths and orders as desired.
Simulation Results
First, let’s look at the 2D and 3D ray diagrams in which we trace rays as they travel through the spectrograph. In these plots, we only trace the marginal rays from the entrance slit to verify the spectrograph geometry and clear aperture parameters.


2D (left) and 3D (right) ray diagrams for the model of the white pupil échelle spectrograph.
Next, we generate an échelle diagram that plots the location of every wavelength in the parametric sweep on the image plane. As seen in the plot below, the échelle dispersion runs from left to right and the cross dispersion moves from bottom to top. These are the same directions that we saw in the 2D échelle spectral format example located at the beginning of this blog post.

Échelle diagram of the white pupil échelle spectrograph.
Next Steps
Want to try this example of a white pupil échelle spectrograph? Find the model documentation and download the related MPH files by clicking the following button.


Comments (0)