
I love my Philips Hue lighting system, which I bought over a year ago. The system allows you to set millions of different colors and thousands of brightness levels for up to 18 bulbs using a smartphone. You can also program the system to automatically turn on as you approach your residence, known as geofencing, or at specific times of the day. But how does the light quality compare to that of other lighting technologies?
An Intuitive Home Lighting System
The Philips Hue system works by varying the amount of blue, green, and red light that is output, which you can set directly from your smartphone. If you are sensitive to a specific color of light, you can simply avoid it. You can set the lighting depending on your mood to help concentrate, energize, read, or relax. For example, there is a “Concentrate” mode that preferentially outputs more blue light, which has shown to enhance the ability to concentrate. When relaxing in the evenings, I use the “Sunset” mode, which provides more red and orange tints.
Having lived with the system for a while now, I’ve also found some long-term advantages:
- I tend to fall asleep more easily at night, compared to when I had my old fluorescent lights.
- My electricity bill has dropped by roughly $21 per month since upgrading the system. This is because a 12 W light-emitting diode (LED) bulb can produce the same optical output as a 60 W incandescent bulb.

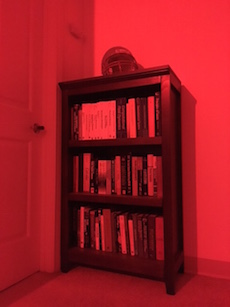

A comparison of some of the lighting system’s settings in my apartment. Left: Soft white. Middle: Red. Right: Blue rain.
I tried convincing my parents to buy the system, but my sales pitch didn’t sway them. I recently bought them the system as a Christmas present, since I am such a good son. The first comment I heard when demonstrating the system was: “Wow, the light feels so natural.” This prompted me to investigate why this is, and whether COMSOL Multiphysics® software can be used to investigate the underlying physics. The answer lies in the emission spectrum produced by the high-efficiency LED bulbs. By comparing the emission spectrum of natural light to that produced by incandescent, fluorescent, and LED bulbs, we can better understand this phenomenon.
Plotting Emission Spectra in COMSOL Multiphysics
The emission spectra for natural daylight, as well as incandescent, fluorescent, and LED bulbs, are plotted below. As you will see, the emission spectra are very different, and none of them can perfectly replicate natural daylight.
Natural Daylight
Let’s start with daylight arriving at the earth’s surface from the sun. There is currently no way of reproducing the emission spectrum with a manmade light source. However, light pipes (or light tubes) can be used to redirect incoming daylight into underground locations, such as subway stations. One example of this is the subterranean train station in Berlin. A light pipe extends out above the station (shown below, in the left image) and collects light, which is transmitted through a special pipe and down into the station underground (shown below, on the right).
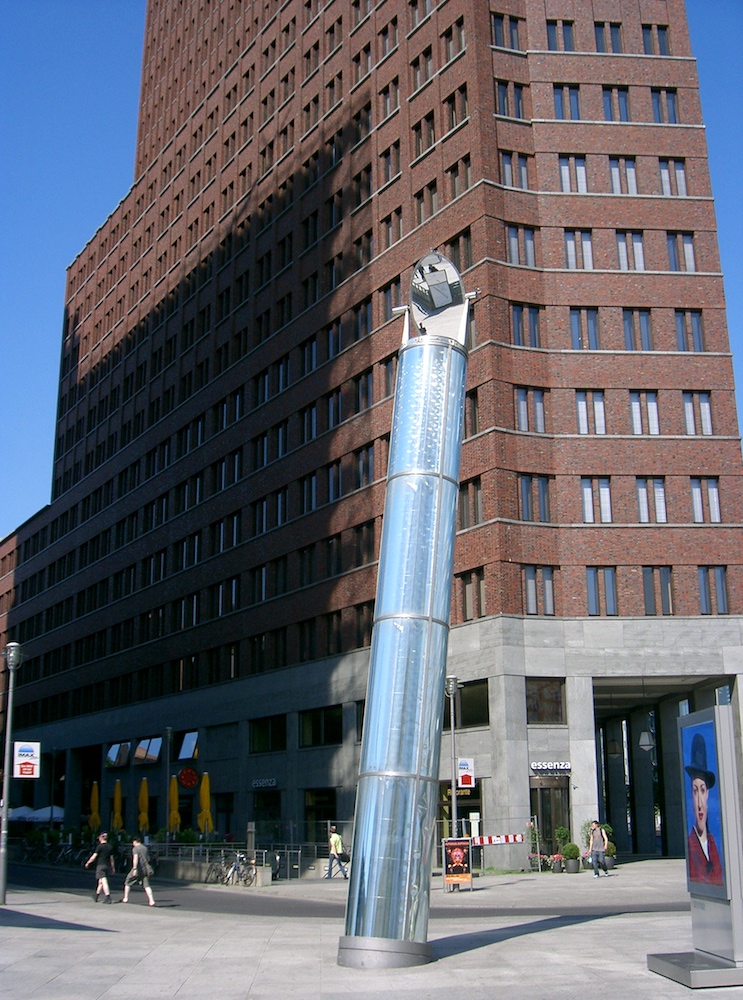

Left: A light tube at the entrance to a train station in Berlin. Image by Dabbelju — Own work. Licensed under CC BY-SA 3.0, via Wikimedia Commons. Right: The light tube transmits light into the underground terminal. Image by Till Krech — Flickr. Licensed under CC BY 2.0, via Wikimedia Commons.
The light pipe creates a more natural illumination of the train station during the day. The obvious drawback of this approach is that it won’t work during the night, creating the need for an artificial light form that mimics natural daylight.
The emission spectrum for natural light generally follows the Planck distribution in the visible part of the spectrum, as we can see below. No color is dramatically favored over another, although the intensity is highest in the light blue region, around 460 nm.
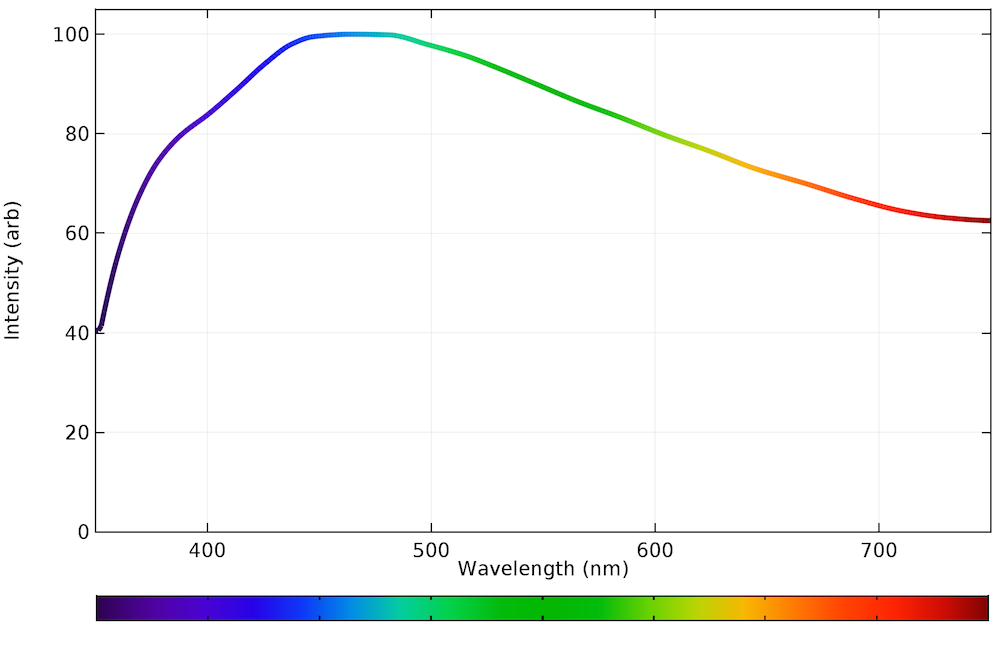
The emission spectrum of visible light arriving at the earth’s surface from the sun.
Incandescent Bulbs
An incandescent light bulb contains a tungsten filament that is resistively heated when a current is conducted through it. At temperatures around 2000 K, the filament starts to emit visible light. To prevent the tungsten wire from burning up, the bulb is filled with a gas, usually argon. The heat generated in the filament is transported to the surroundings through radiation, convection, and conduction. An incandescent bulb emits a greater proportion of red light than natural daylight. Emission even extends into the infrared part of the electromagnetic spectrum, which wastes energy and reduces the overall efficiency of the bulb.

The emission spectrum in the visible range of a typical incandescent bulb.
Fluorescent Bulbs
A fluorescent lamp typically consists of a long, glass tube containing a low-pressure mixture of mercury and a rare gas, such as argon. Inside of this tube, a nonequilibrium discharge is produced (a plasma). This means that the electron temperature is different from the temperature of the surrounding gas mixture. For example, the electron temperature can be on the order of over 20,000 K, but the gas temperature stays relatively close to room temperature, 300 K. Since the plasma is not in equilibrium, the electron impact reactions modify the chemical composition of the gas mixture in a manner governed by the collisional processes. These collisions can produce electronically excited neutrals, which can subsequently produce spontaneous emission of photons at specific wavelengths.
Visible light is produced by two mechanisms: optical emission directly from the discharge, or by exciting phosphors on the surface of the tube. Fluorescent lights often cause problems for people suffering from a visual disorder called Irlen syndrome, and anecdotally, people often complain of headaches and migraines when exposed to fluorescent lights for extended periods of time.
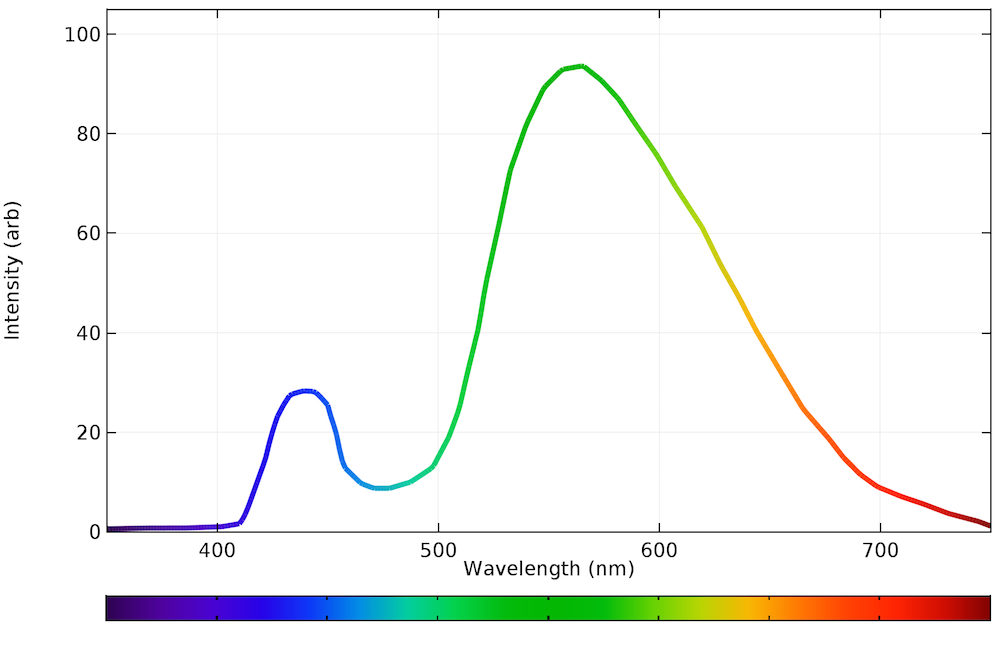
As you can see in the graph below, the emission spectrum in a fluorescent light source looks rather strange. The quantization is either due to direct emission from the plasma or by the phosphors, but to a human eye, the light emitted still seems white. Like incandescent bulbs, fluorescent bulbs can be inefficient because the plasma needs to be sustained and it emits radiation in the nonvisible range.

The emission spectrum of a typical fluorescent bulb.
LED Bulbs
LEDs are revolutionizing the lighting industry, as they are often much more efficient in terms of the luminous efficacy and more durable than traditional incandescent light technologies. For example, typical consumer LED light bulbs operate at 10-20% of the power needed to run an incandescent bulb of comparable brightness. They also have lifetimes of over 25,000 hours, compared to only 1000 hours for incandescent bulbs.
LEDs are so much more efficient than incandescent bulbs because they function in a very different way. LEDs are semiconductor devices that emit light when electrons in the conduction band transition across the bandgap via radiative recombination with holes in the valence band. Unlike incandescent bulbs, LEDs emit light over a very narrow range of wavelengths.
Initially, red, green, and yellow LEDs were developed in the 1950s and 1960s. However, it was the invention of the blue LED that led to the creation of new, efficient white light sources. Blue light emitted from such LEDs can be used to stimulate a wider spectrum of emission from a phosphor layer around the LED casing, or can be directly combined with red and green LEDs to create white light.
As shown in the graph below, the LED spectra for a yellow phosphor setting gets closer to that of natural daylight. There is more blue light than the incandescent bulb and nearly all of the power is emitted within the visible spectrum.
The emission spectrum of a typical LED bulb on a warm, white setting.
Combined Light Sources
The different emission spectra are plotted on the same axis below. While none of the bulbs exactly reproduce natural daylight, the LED bulb is clearly the best approximation. All of the emission occurs within the visible range, making the device very efficient.
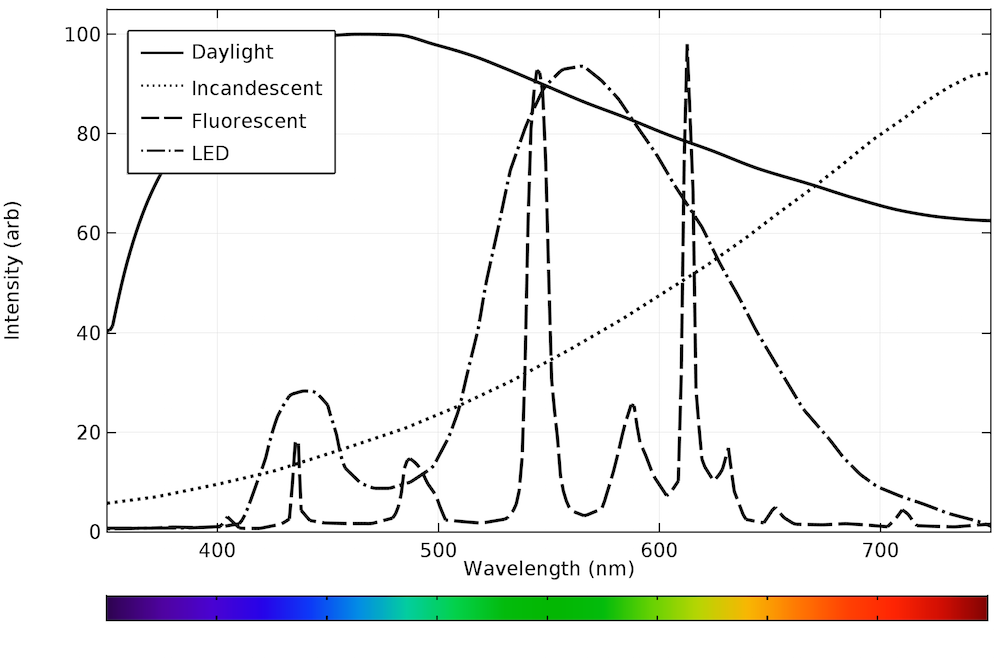
Emission spectra from daylight and typical incandescent, fluorescent, and LED bulbs.
In general, incandescent and fluorescent bulbs have a fixed optical output. LED bulbs with a fixed emission spectrum are also available. By plotting the emission spectra of the different light sources, we can infer that LED bulbs most closely replicate natural daylight.
Discover More Ways to Model Light Sources
As we’ve seen in this blog post, there are many different ways of creating artificial light. All of the methods described above can be modeled in various levels of detail using COMSOL Multiphysics with either the Semiconductor, Plasma, Heat Transfer, or Ray Optics modules.
- Read a blog post:
- Download a tutorial model:
PHILIPS is a registered trademark of Koninklijke Philips N.V. and its affiliates.


Comments (1)
Jimeng Shi
June 11, 2019Hi,
Glad to see your report above! I’m a Master student majoring in Mechanical Engineering. Now I’m suffering from a question that how to download argon cross section from the link (http://www.lxcat.laplace.univ-tlse.fr/cross_sec_download.php) and import to COMSOL. So could you please do me a favor? I’ll really appreciate.