Results & Visualization Blog Posts
A Simulation Color Table for Engineers with Color Vision Deficiency
Simulation results often use color to present data and emphasize certain takeaways, but what about engineers with color vision deficiency? Cividis is a color table designed specially for this.
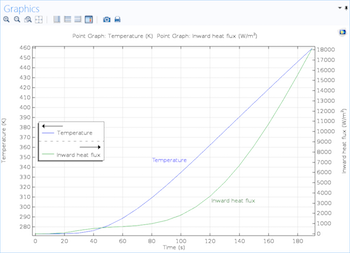
How to Create Graphs with Two Y-Axes in COMSOL Multiphysics®
Did you know that you can add a second y-axis to a 1D plot to include two scales of values in your simulation results? This blog post details how and also includes a video demonstration.
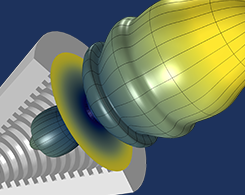
How to Generate Randomized Inhomogeneous Material Data
Did you know there is a way to take randomized material data with specified statistical properties determined by a spectral density distribution and use it to generate and visualize results?
How to Manage Multiple Solutions in COMSOL Multiphysics®
3 ways to manage multiple solutions in COMSOL Multiphysics®: Combine 2 solutions into 1, store the solutions in different data sets, or join the solutions to compare them.
Exploiting Maximum Principles to Save Time and Resources
By exploiting maximum principles in large and complex models, you will save time and computational resources without having to buy a bigger computer or leave your model to solve overnight.
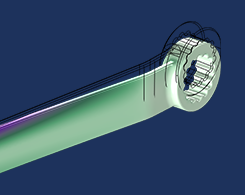
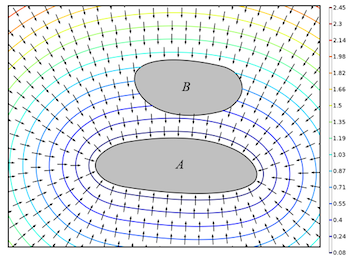
How to Postprocess Fields over Arbitrary Geometries
Check out this useful modeling trick: You can query the results of your model within an arbitrary geometric subregion by implementing an integration during postprocessing.
How to Compute Distances Between Objects in COMSOL Multiphysics®
Compute the distance between two deforming objects in the COMSOL Multiphysics® software. Here’s how…

Generating Animations to Visualize Your Simulation Results
Why create animations from your COMSOL Multiphysics® simulation results? We share 4 reasons in this blog post.