Consider a class of civil engineering structures like the Pratt truss bridge. While the concept behind each design is similar, the actual configuration of the bridge and the loads that are applied to it varies by each case. With the Application Builder, you can design a simulation tool that enables users to easily modify parameters to account for these differences in geometry and loads. Learn more with our Truss Bridge Designer computational app.
The Pratt Truss Bridge, a Classic and Efficient Civil Engineering Design
The Pratt truss bridge has been a popular structural design among civil engineers for many years. This type of structure can be easily identified by the diagonal beams on each side that, aside from the ones at the very end, slant toward the center of the span of the bridge. Due to its design, the diagonal beams are only subject to tension, and can be made from a lighter and less expensive material. The shorter vertical beams, which are not as sensitive to buckling, undergo compression.
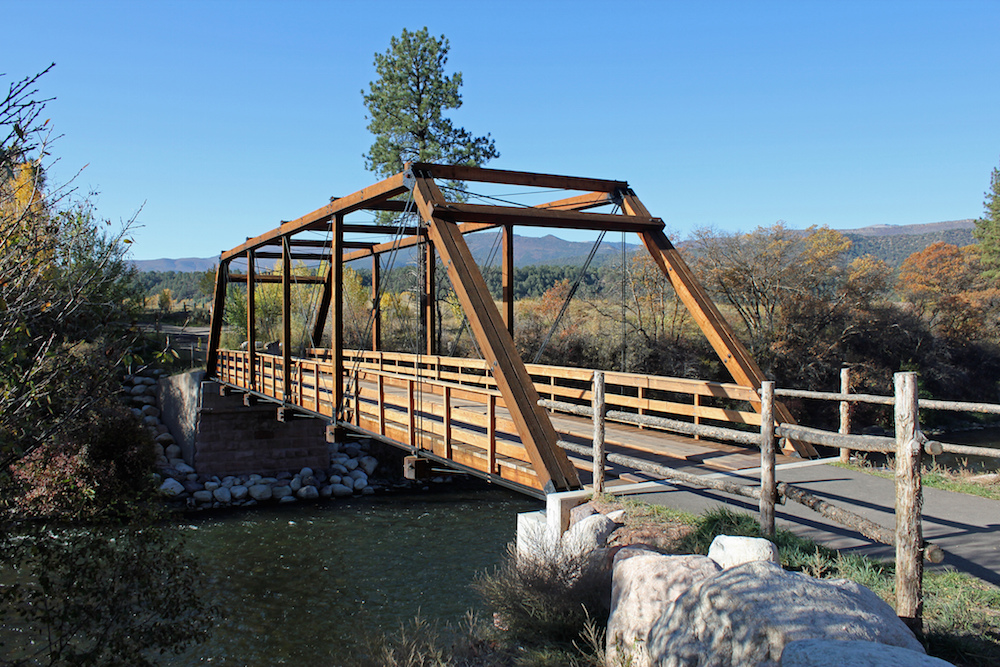
A Pratt truss bridge. Image by Jeffrey Beall — Own work. Licensed by CC BY-SA 2.0, via Flickr Creative Commons.
As with any class of civil engineering structures, exposure to various forces, from vehicles to wind, can greatly impact the safety and stability of Pratt truss bridges. Accounting for these factors requires an understanding of the different loads placed on the structure as well as the dimensions of the particular bridge. Computational apps deliver the capabilities for assessing both of these elements, all while spreading simulation power to a larger number of people through an easy-to-use interface. Let’s take a look at one example…
Designing an App to Analyze Various Bridge Configurations and Loads
The Truss Bridge Designer is an app based on our tutorial model of a Pratt truss bridge. The embedded model, and the underlying theory, are hidden behind a simplified interface that is easy for users to navigate and utilize. As the designer of the app, it is up to you to decide how to organize the layout and design of your app, as well as select the parameters that you want to include.

The user interface (UI) of the Truss Bridge Designer app.
The demo app, shown above, includes two main sections: the Inputs section and the Results section. Within the Inputs section, users can modify the dimensions of the bridge, cross-section data of the supporting beams, and thickness and drag coefficient of the roadway. The Wind load subsection can be used to specify if a wind load is applied and set the wind direction and intensity. The Truck load subsection, meanwhile, gives users the option to specify the location and mass of the trucks applied in the stationary analysis. When adding the number of trucks, the following criteria must be met:
- A truck can be positioned in a way that just one axle is inside the bridge, but it can’t be completely outside of the bridge
- A truck can’t have wheels that are outside the bridge in the y direction
- Trucks must not overlap each other when several of them are added
If the truck positions don’t meet the above criteria, a warning message will appear and the Compute Stationary button will be disabled. Notifications such as this help provide guidance to users as they run their own simulation tests, ensuring consistency in the results.
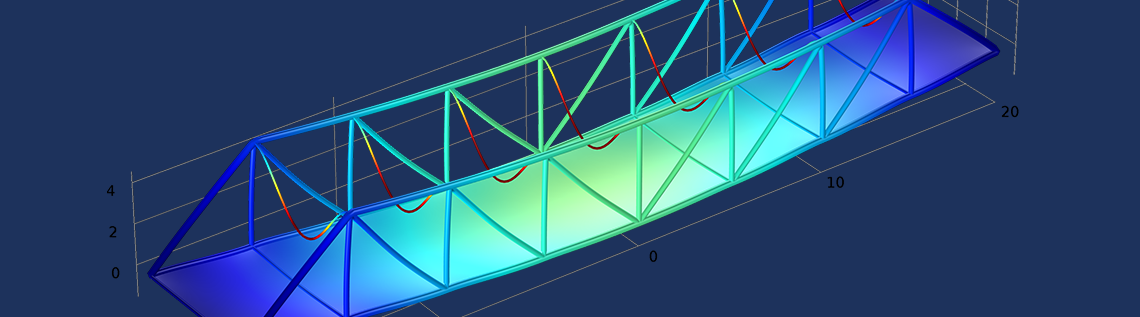
Now that we’ve reviewed the Inputs section, let’s move on to the Results section. Here, you will find a series of tabs featuring multiple plots. The Preprocessing Data tab, for instance, includes four selectable plots. As the bridge dimensions are modified, the Geometry plot will automatically update. The Truck Load, Wind Load, and Beam Orientation plots can be updated manually by simply clicking the Update Preprocessing button to reflect changes in the input data.
The Stationary Results tab features four selectable plots as well: Displacement, Force and Moment in Beams, Stress in Beams, and Stress in Roadway. Users have the option to select the component of force or moment that they want to plot for the force and moment plots, as well as if they want to plot their results on all of the beams or just a group of them.
The final tab is Eigenfrequency Results. This section shows the normalized displacement of the mode shape that is specified in the selector located right above it.
What if the user wants to share their simulation results with others? With the Generate Report button, this step is simple. By clicking the button, they can generate a report that includes simulation results from the app and, carrying on with the theme of customization, further details that they wish to highlight.
Computational Apps Serve as a Viable Tool for Studying Civil Engineering Structures
Every design team experiences their own set of challenges. With the Application Builder, you can create a tool that is tailored to your specific design, while enabling additional members of your team or other departments within your organization to run their own tests. As we have demonstrated today with a Pratt truss bridge example, simulation apps can serve as a viable foundation for analyzing classes of civil engineering structures, customizing the analyses to fit specific structural designs and load conditions.
Feeling inspired? Use the resources below as a jumping-off point to start building apps of your own.
Resources for Building Apps
- Download the app presented here: Truss Bridge Designer
- Watch this video for a quick introduction on turning COMSOL Multiphysics models into apps
- Browse the COMSOL Blog for further inspiration and guidance in building simulation apps


Comments (0)