
Some chemical applications call for identification and quantification of the components in a chemical mixture. High-performance liquid chromatography (HPLC) is a versatile separation technology for chemical species. To learn more about the separation process, we can model it with simulation software.
About the HPLC Method
High-performance liquid chromatography (HPLC) is a multistep process designed to separate the chemical components in a mixture. There are many other liquid chromatography methods out there, but HPLC is the most versatile due to its ability to be well controlled and provide relatively high through-puts. The system is much like column chromatography, pushing solvents through at a high pressure, instead of gravity like traditional methods. The high pressure allows for a much faster run-time.
In essence, HPLC involves mixing a solvent (mobile phase) from a reservoir (#1 in the image below) with a sample zone containing the analytes that are to be separated (#4) and then pumping (#5) the mixture into an injector (#7). The injection is an automated step of the process. Then, the mobile phase carries the analyte through a column that contains a solid stationary phase (#9). If the analyte is not colored, a detector (#10) is needed in order to know when it has passed through the column. The detection data is stored for analysis (#11) and the waste is collected (#12).
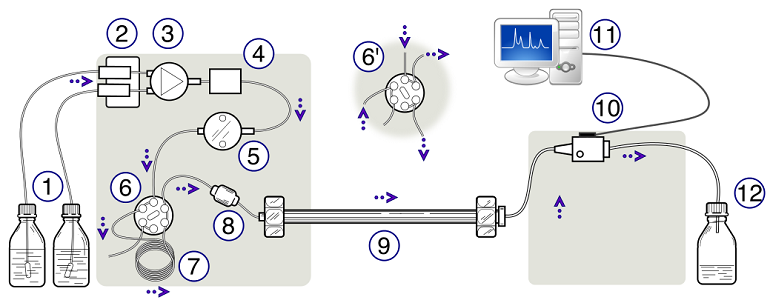
An HPLC apparatus. Image credit: Yassine Mrabet.
Here’s another, simpler version of the diagram above:
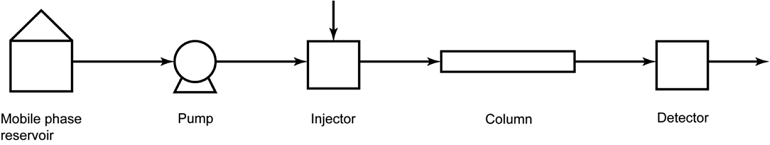
A simplified schematic of an HPLC system.
Applications of Liquid Chromatography
Liquid chromatography is used in many settings. It is commonly used in research and development (R&D), quality control, and manufacturing at biotech and pharmaceutical companies, for instance. Additionally, the separation technique may be used for monitoring water, food, and environmental effects. Liquid chromatography is also used in medical or forensic scenarios directly involving patients or clients.
High-Performance Liquid Chromatography Modeling Example
If you want to analyze the separation of two species, you could set up a lab experiment according to the numbered diagram above. Alternatively, you could set up a simulation using COMSOL Multiphysics and the Chemical Reaction Engineering Module.
Suppose there are two components in the mobile phase and we want to determine their concentration levels after flowing through the column. Before modeling the increased concentrations, we need to solve for low initial injector concentrations. That way we can compare the different results. Then, we increase the concentration of analyte carried by the mobile phase, so that the chromatography is nonlinear. We’ll skip the detailed steps here, but you can follow them by reading the model documentation.
Linear Chromatography Results
The initial analyte concentration is low (both components are of 0.1 mol/m3). This means that the solution will be in the linear domain. Plotting our results, we can see that the sample zones are normally distributed and symmetrical:
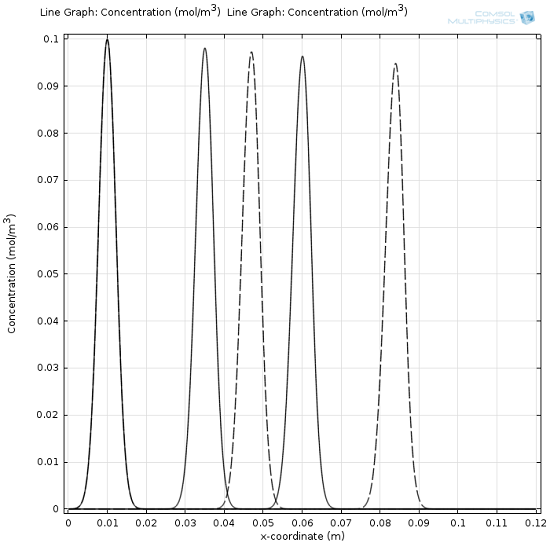
Initial injector concentrations of 0.1 mol/m3 for both components.
Nonlinear Chromatography Results
Now, what happens when we increase the two components’ concentrations to one and ten mol/m3, respectively? Well, we can see that the behavior changes dramatically, as the solution is now in the nonlinear domain:
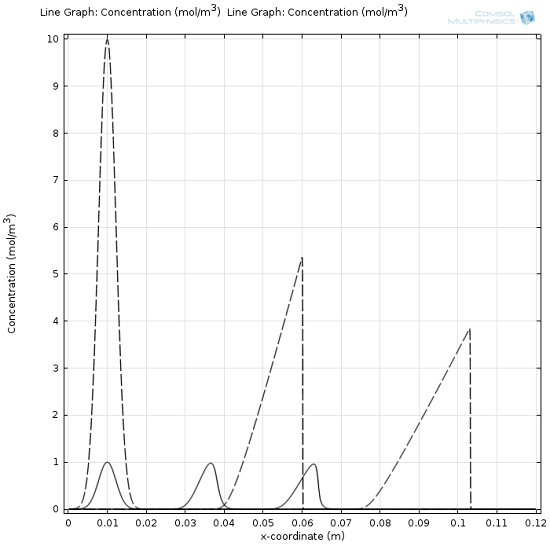
Nonlinear chromotography: Concentrations of the two components (1 is shown as solid and 2 is dashed) in the mobile phase while flowing through the column at 0, 80, and 160 seconds. The initial injector concentrations for c01 = 1 mol/m3 and c02 = 10 mol/m3.


Comments (0)