
In my previous two blog posts about the 2026 FIFA World Cup®, I discussed the official match ball, the Adidas Trionda®, and the aerodynamics of the iconic trivela, the outside-of-the-foot shot perfected by players such as Éder and Roberto Carlos. I ended the second blog post about the sensor technology being used this year with a short animation from an acoustics simulation of Mexico City’s Banorte Stadium, better known as Estadio Azteca.
Ahead of Mexico’s home-turf match against Czechia tomorrow at this legendary stadium, let’s look at its acoustics in detail.
Sacred Football Ground
Together with Rio de Janeiro’s Maracanã Stadium, Estadio Azteca (dubbed “Mexico City Stadium” by FIFA® for the 2026 tournament) is one of only two stadiums to have hosted two World Cup finals. But the Maracanã of the 2014 World Cup final is essentially a different stadium from the one where Uruguay defeated Brazil in front of nearly 200,000 fans in the Maracanazo of 1950. The Azteca that hosted Pelé in 1970, on the other hand, is still recognizably the same stadium that’s hosting the World Cup today.
No stadium has witnessed more historic World Cup moments. Pelé won his third World Cup here. In 1986, Maradona scored both the “Hand of God” and the “Goal of the Century” here, arguably the most controversial goal and the greatest goal in football history, separated by only four minutes.
When it hosted the 2026 opening match between Mexico and South Africa, Estadio Azteca became the first stadium in history to host matches in three FIFA World Cups. Reverently referred to by fans as el gigante (“the giant”, as it was immortalized in song by Andrés Calamaro) and El Coloso de Santa Úrsula for its massive capacity, the Azteca is sacred ground for football.
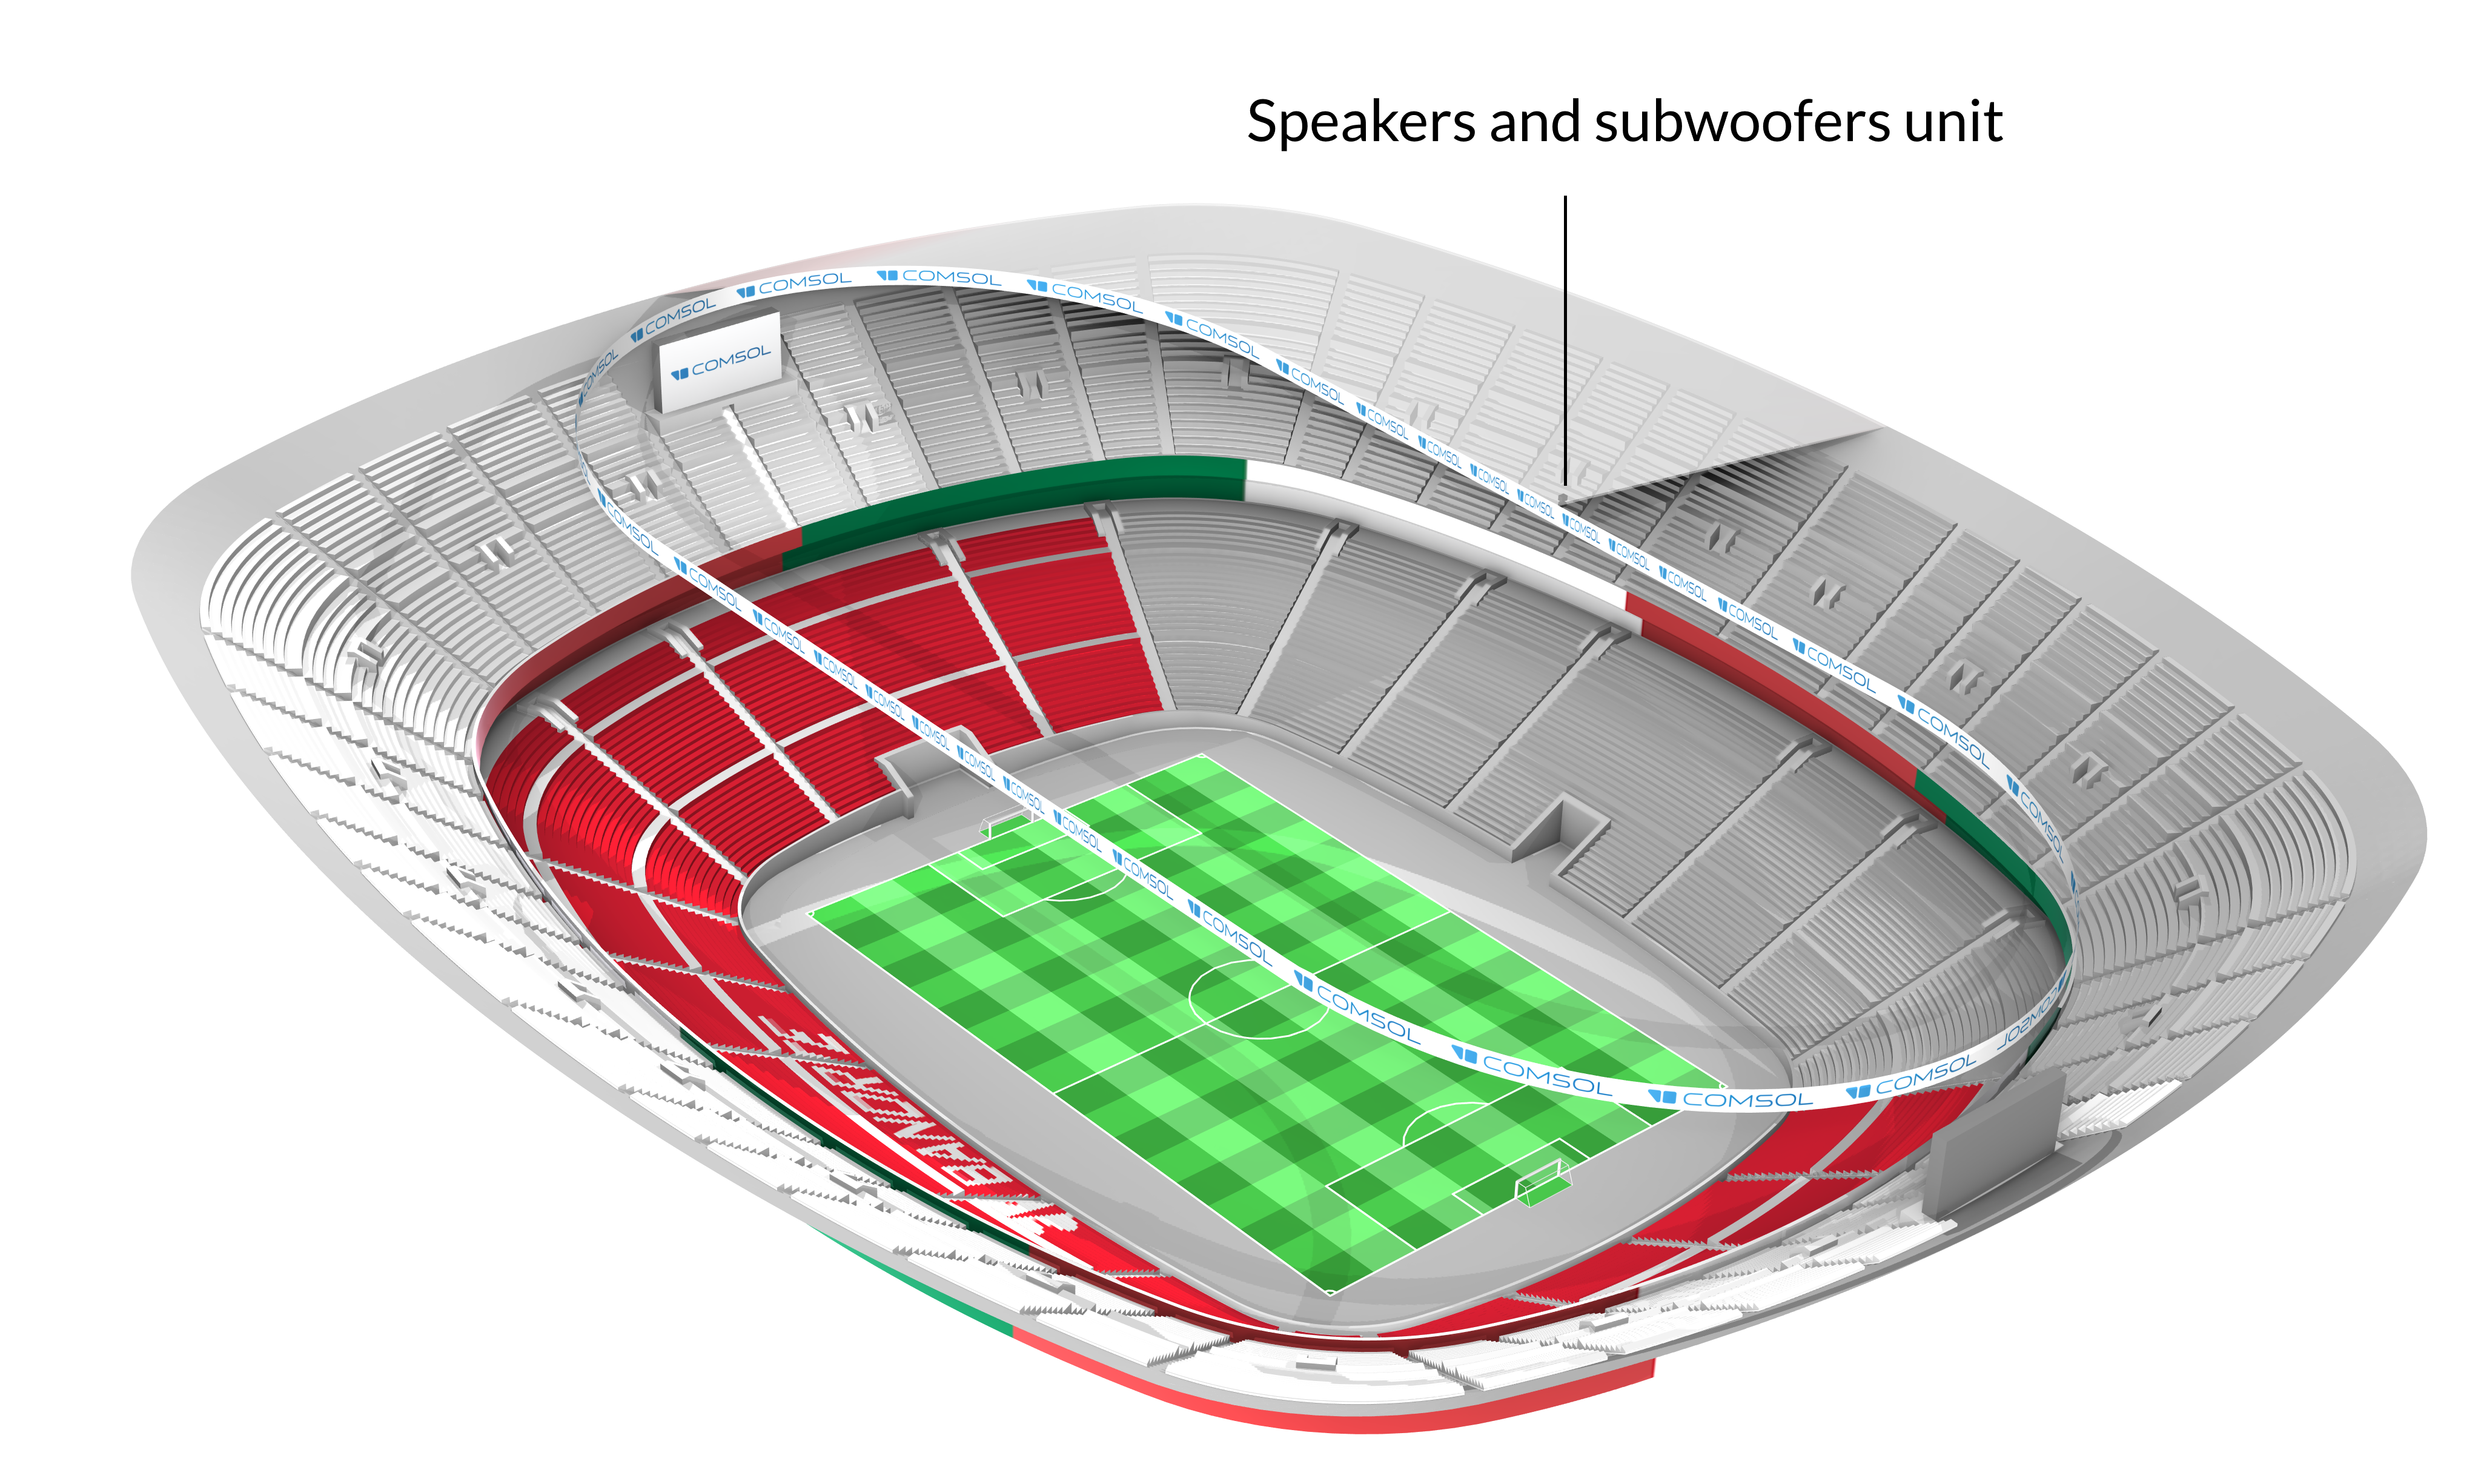 Figure 1. A COMSOL Multiphysics® representation of Estadio Azteca. Note that this is not an exact representation of the stadium, but it’s good enough for our investigation, which is mainly for fun.
The Acoustics of a Football Stadium
The sound of a football stadium is about much more than acoustics. Every supporter knows that their home stadium sounds better than any other stadium in the world when their team scores. This is one of the great experiences of football fandom.
As engineers, however, we need to quantify the sound of a stadium. FIFA specifies requirements for quantities such as the speech transmission index, reverberation time, and the uniformity of the sound field in the stands (Ref. 1). These quantities can be measured objectively and are used when designing the stadium sound system to ensure that spectators can clearly hear announcements and other information provided through the PA system.
FIFA specifies the following design targets for these quantities:
- Reverberation time should be no more than 4 s in the frequency range 125–4000 Hz.
- Speech transmission index should exceed 0.55 for a full stadium. (The recommendation is 0.75.)
- Nonuniformity of the sound field should be no more than ±3 dB.
These quantities can also be simulated, which is what our team did to estimate the quality of the sound from Estadio Azteca’s brand new PA system. We started by focusing on the sound from a single loudspeaker cluster, simulating how it propagates through the stadium.
Can You Hear the Giant?
The new sound system of Estadio Azteca was installed in 2026 and appears to comprise roughly 340 loudspeakers. Based on photographs from the renovation and information published on social media, the system appears to be supplied by d&b audiotechnik®. The loudspeaker clusters hanging from the roof appear to consist of four loudspeaker cabinets and two subwoofers. Based on their appearance, I believe the loudspeakers may belong to the d&b audiotechnik Vi or Yi series.
For our simulations, we took one of these loudspeaker clusters and placed it just below the roof, as shown in Figure 1. Figure 2 shows a close-up of the loudspeaker cluster and the resulting total acoustic pressure in the stands below.
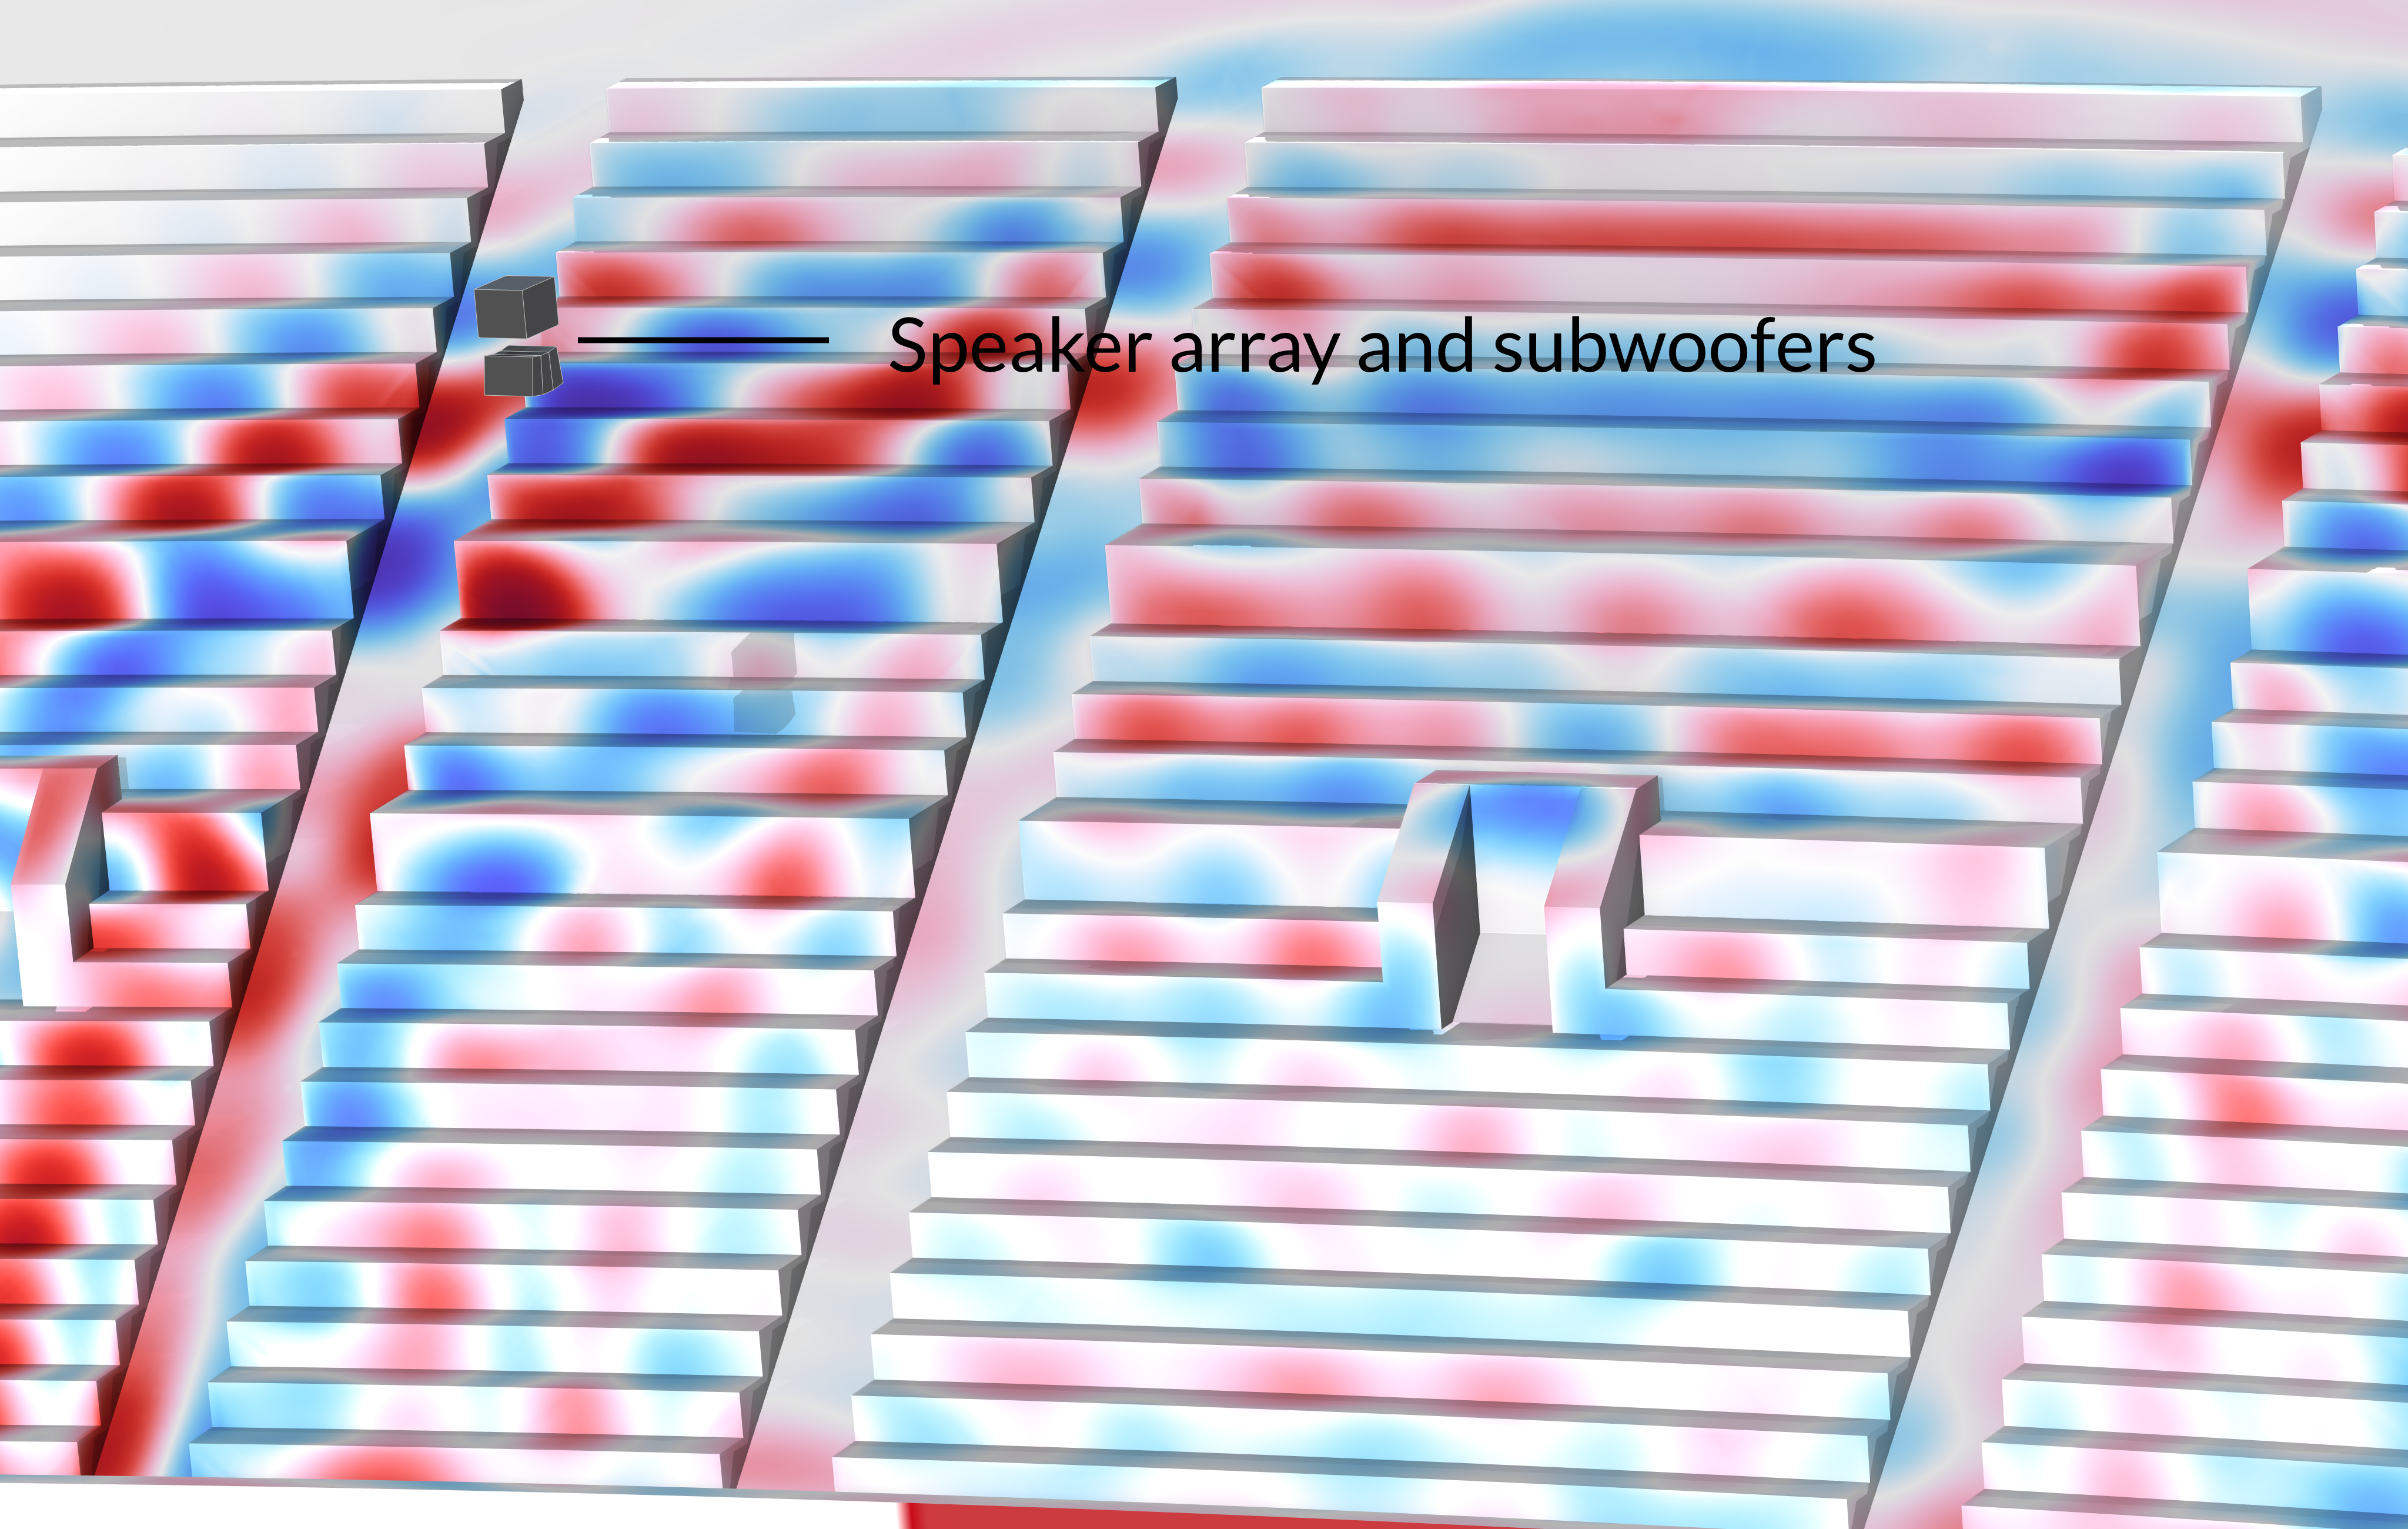 Figure 2. The loudspeaker cluster hanging from the roof of Estadio Azteca and the resulting total acoustic pressure in the stands below.
We created the geometry using the built-in geometry tools in COMSOL Multiphysics® and used the Pressure Acoustics, Time Explicit interface to model the acoustics in the low frequency range and the Ray Acoustics interface for the high frequency range.
The Pressure Acoustics, Time Explicit interface automatically defined the numerical model using fourth-order discontinuous-Galerkin-based functions, which for a representative frequency of 100 Hz required the mesh shown in Figure 3. The mesh consisted of grid elements (a feature that will be available in the upcoming release) in the bulk, with pyramids and tetrahedrons close to the stands, the pitch, and the roof. The resulting system of equations contained 99 million degrees of freedom and was solved in 1 hr 55 min on two NVIDIA RTX™ 6000 Ada Generation GPUs.
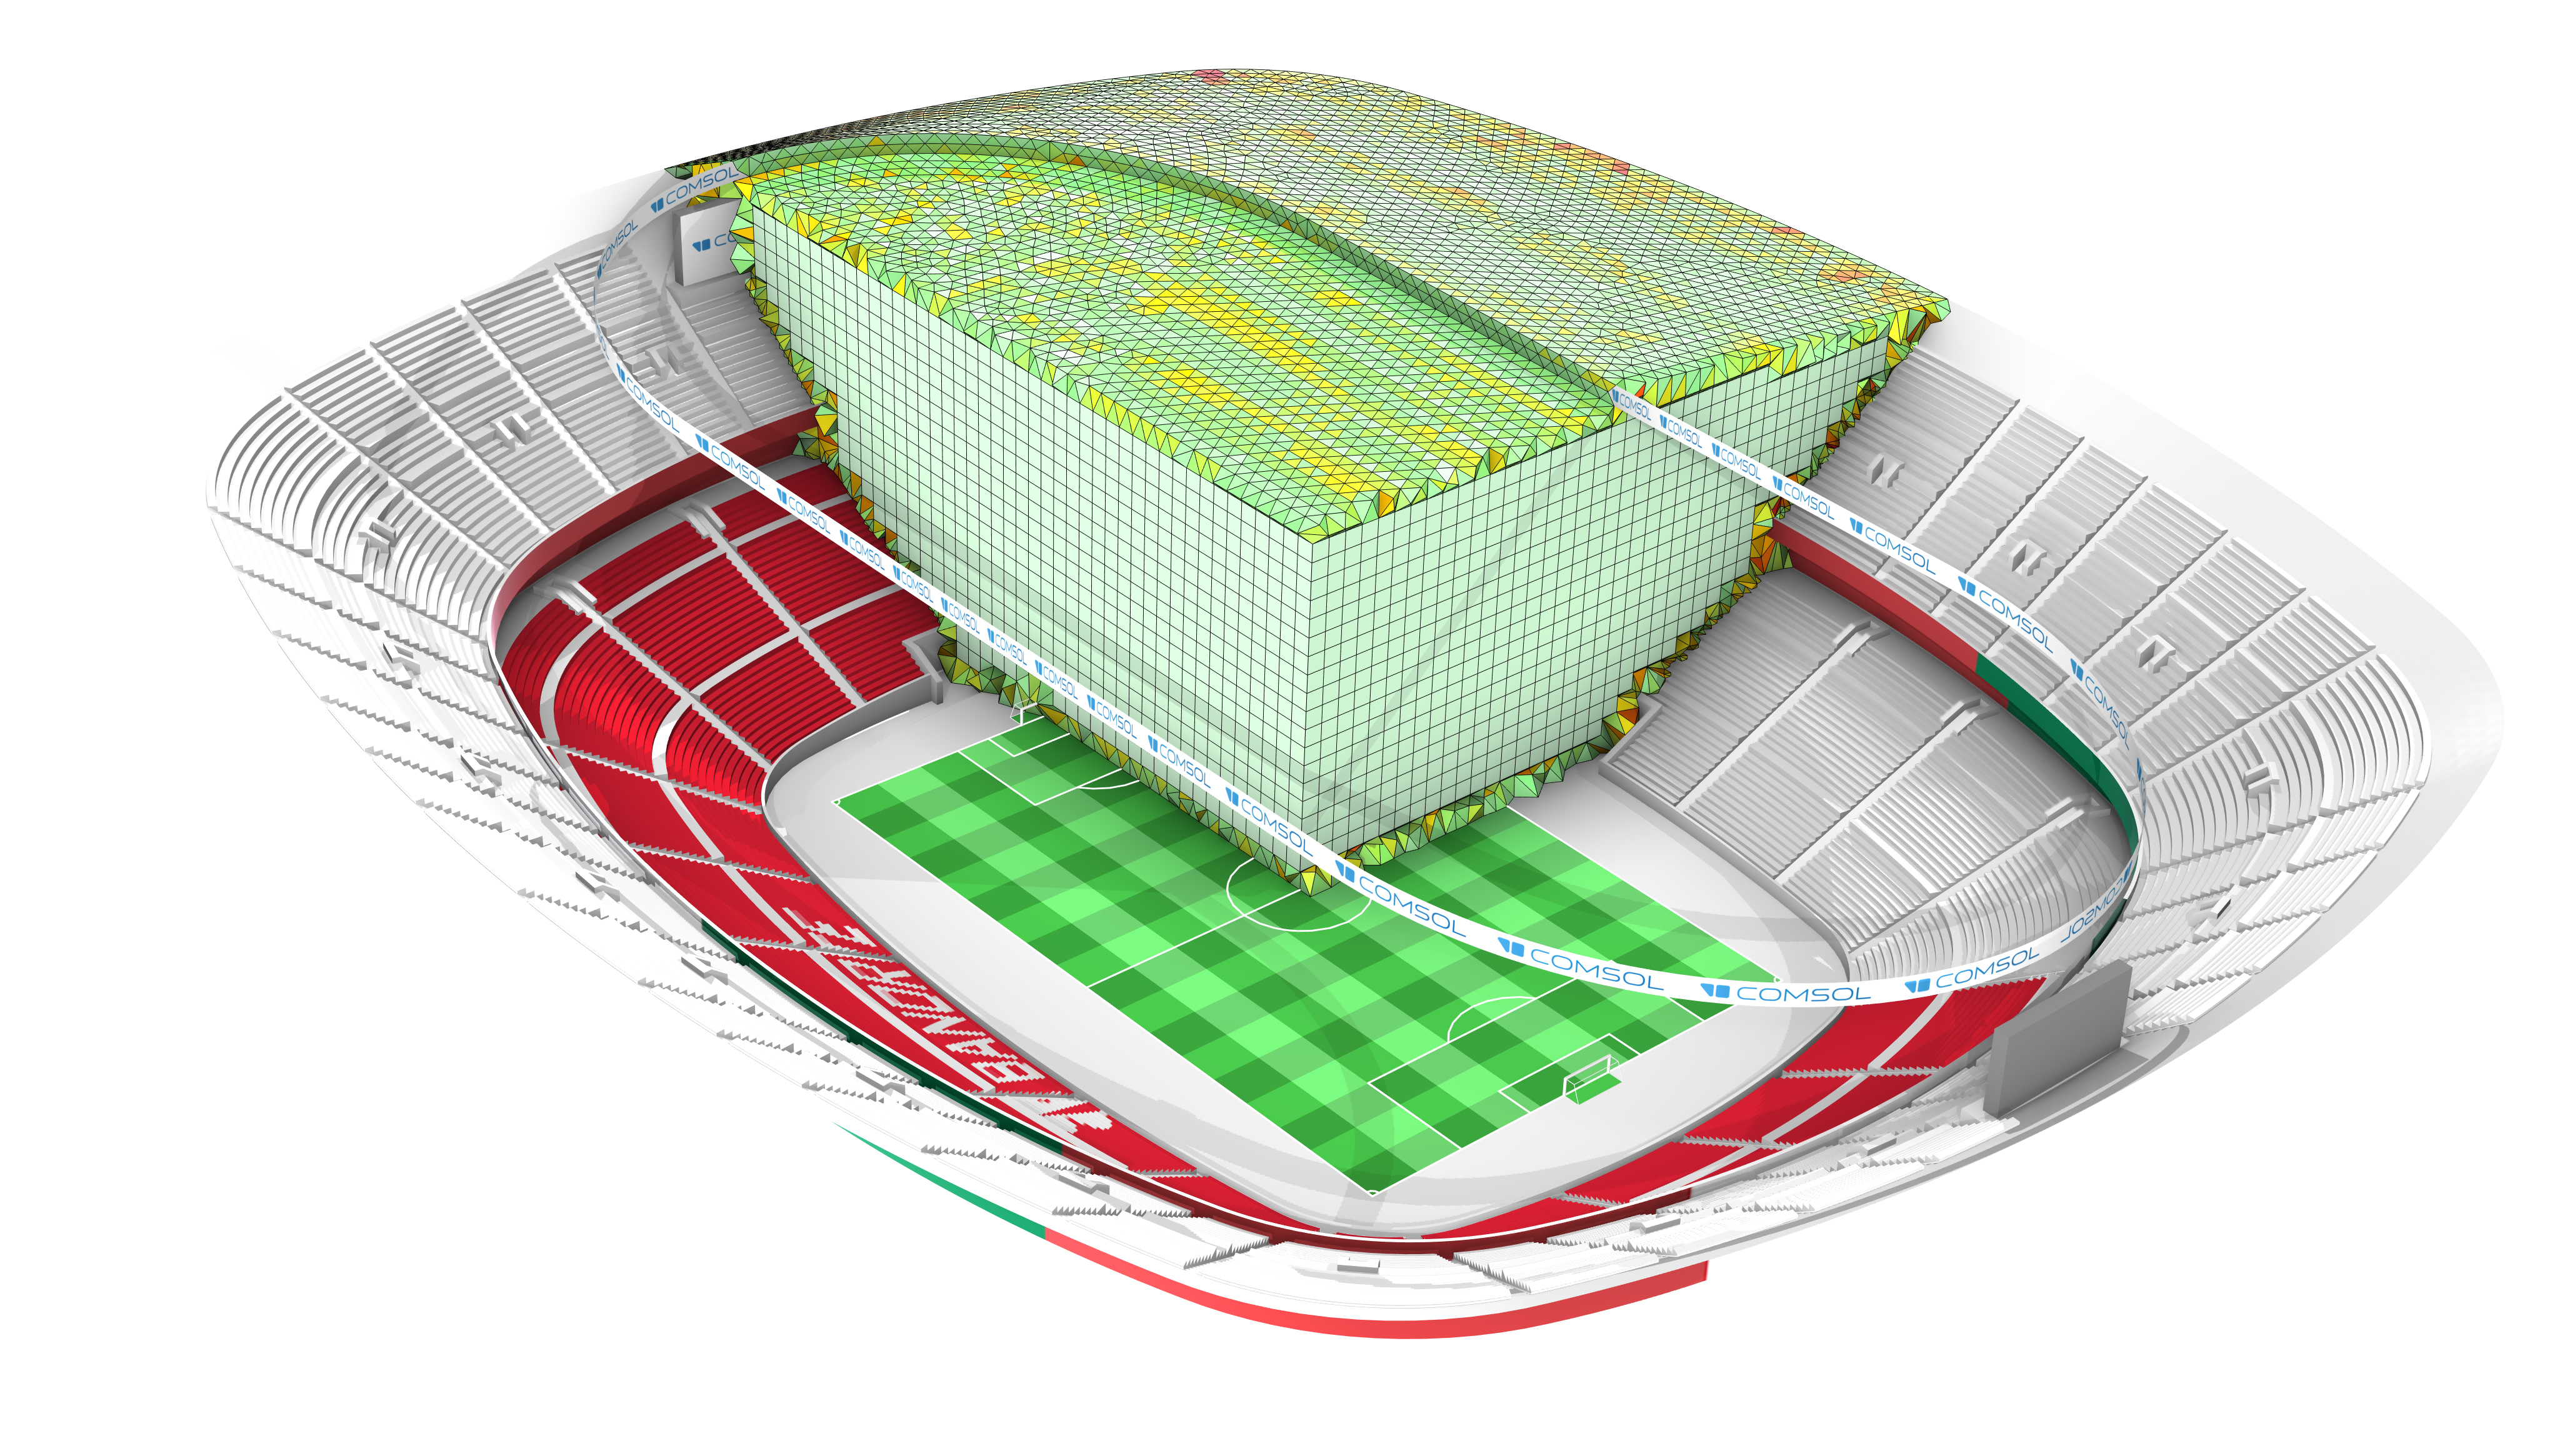 Figure 3. A cross section of the volume mesh and the surface mesh used in the numerical model of Estadio Azteca.
Figure 4 shows an animation of the total acoustic pressure (visualized on surfaces) during 0.4 s in the stands that are reached by the output of the central loudspeaker cluster. Based on available photographs of Estadio Azteca, there appear to be roughly 30–40 such clusters hanging from the roof and additional clusters located in the stands and along the sides of the pitch. If we placed all of these loudspeaker clusters around the stadium in the model, we could estimate diffraction effects and the combined contribution from all sound sources at low frequencies throughout the stands.
Figure 4. Animation of the total acoustic pressure generated by the central loudspeaker cluster hanging from the roof.
In the low frequency range, effects such as diffraction are important and are best captured using a wave-based method, as illustrated above. As the analyzed frequency increases, the computational cost also increases and it is common practice to switch to a high-frequency method such as ray tracing.
In the Ray Acoustics interface, we can easily define a source with a given spatial directivity. The source data can be imported from a file or created in a model, as in this case, where we used the model of the loudspeakers and subwoofers. A simplified model representation of the loudspeaker cluster at the Azteca is shown in Figure 5. The sound radiation pattern is computed using the Pressure Acoustics, Boundary Elements interface (based on the boundary element method, or BEM).
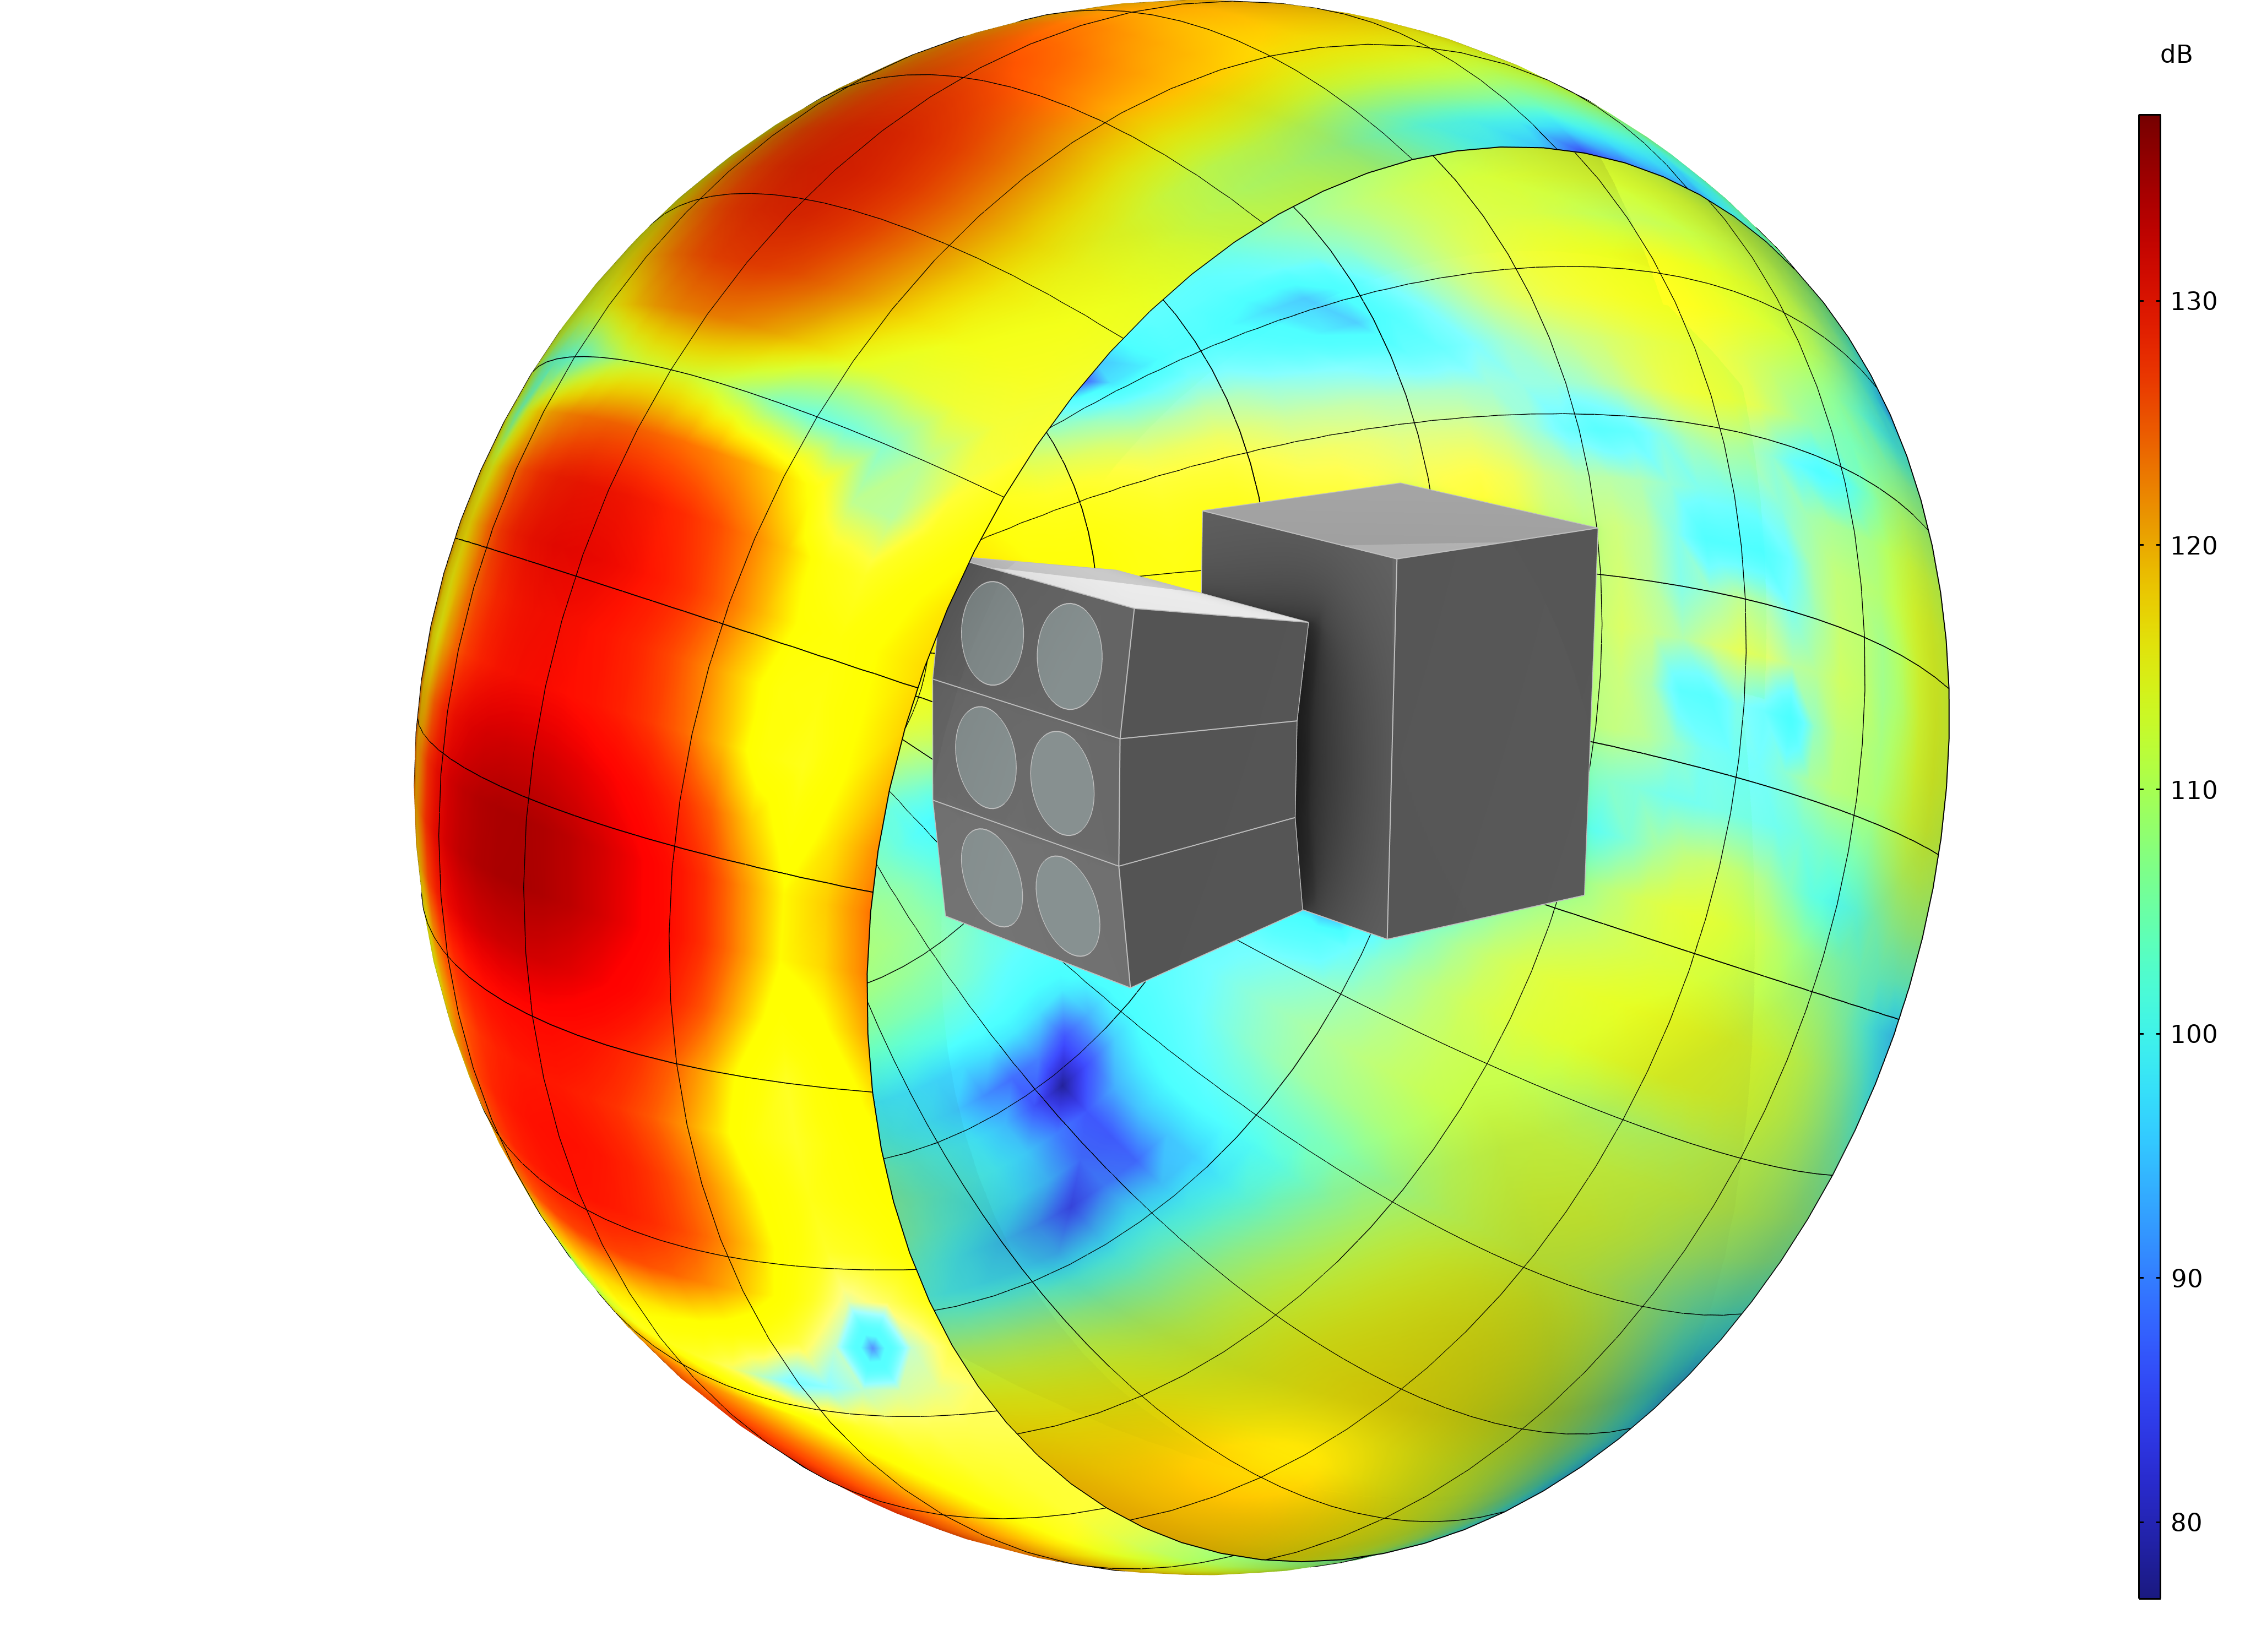 Figure 5. Radiation plot (bubble plot) of the simplified loudspeaker cluster used at Estadio Azteca at 1000 Hz, computed using the BEM. Note that the level shown is relative.
The propagation of rays from the speaker cluster, with the source characteristics shown in Figure 5, is illustrated in the animation in Figure 6. The animation includes just 10,000 rays, but a practical simulation could easily be performed using many more. The model equations solved in minutes.
Figure 6: Ray propagation from the speaker array.
The resulting sound pressure level map in a plane just above the seating area is shown in Figures 7 and 8, for one and two speakers, respectively. You can see in both plots that the nonuniformity is much larger than FIFA’s target of ±3 dB. However, adding just one additional speaker improves the coverage. In a real stadium design, additional loudspeaker clusters would likely be used to improve the coverage of the central part of the stands. From fan footage of Estadio Azteca, you can tell that at least 4–5 of the loudspeaker clusters hanging from the roof would likely cover the plot area in Figures 7 and 8.
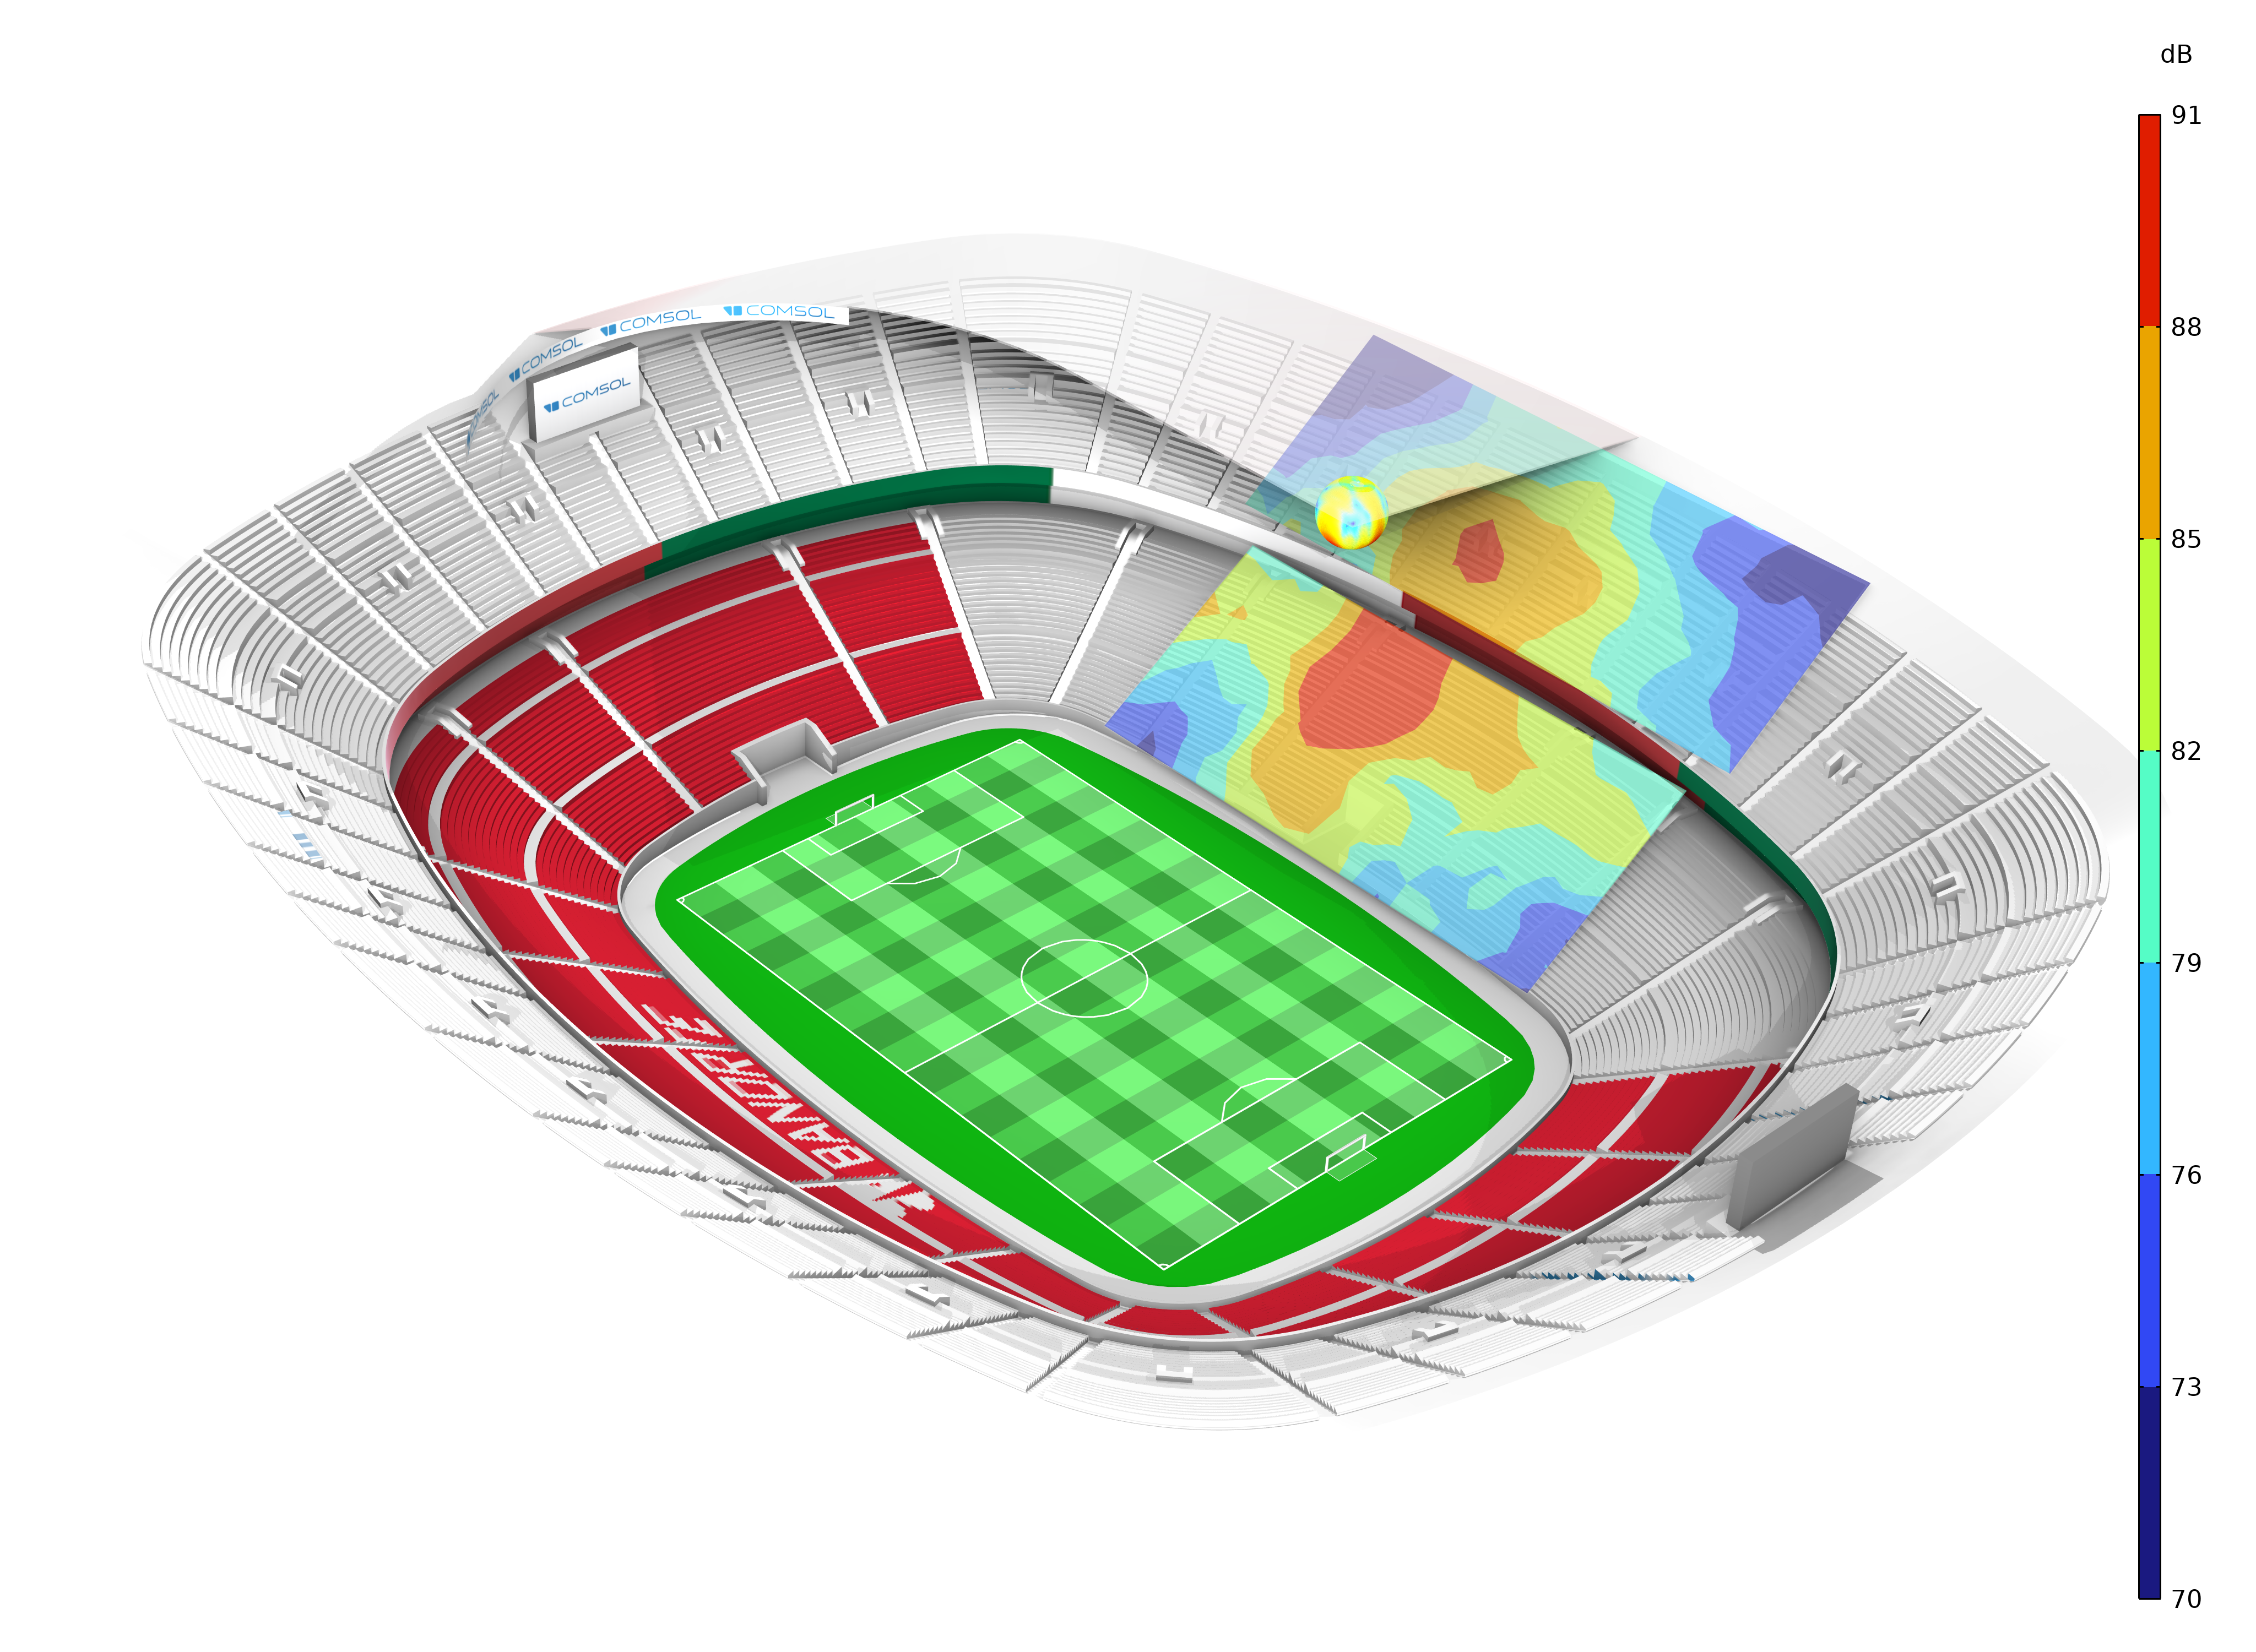 Figure 7. Sound pressure level map just above parts of the seating area below the location of one speaker.
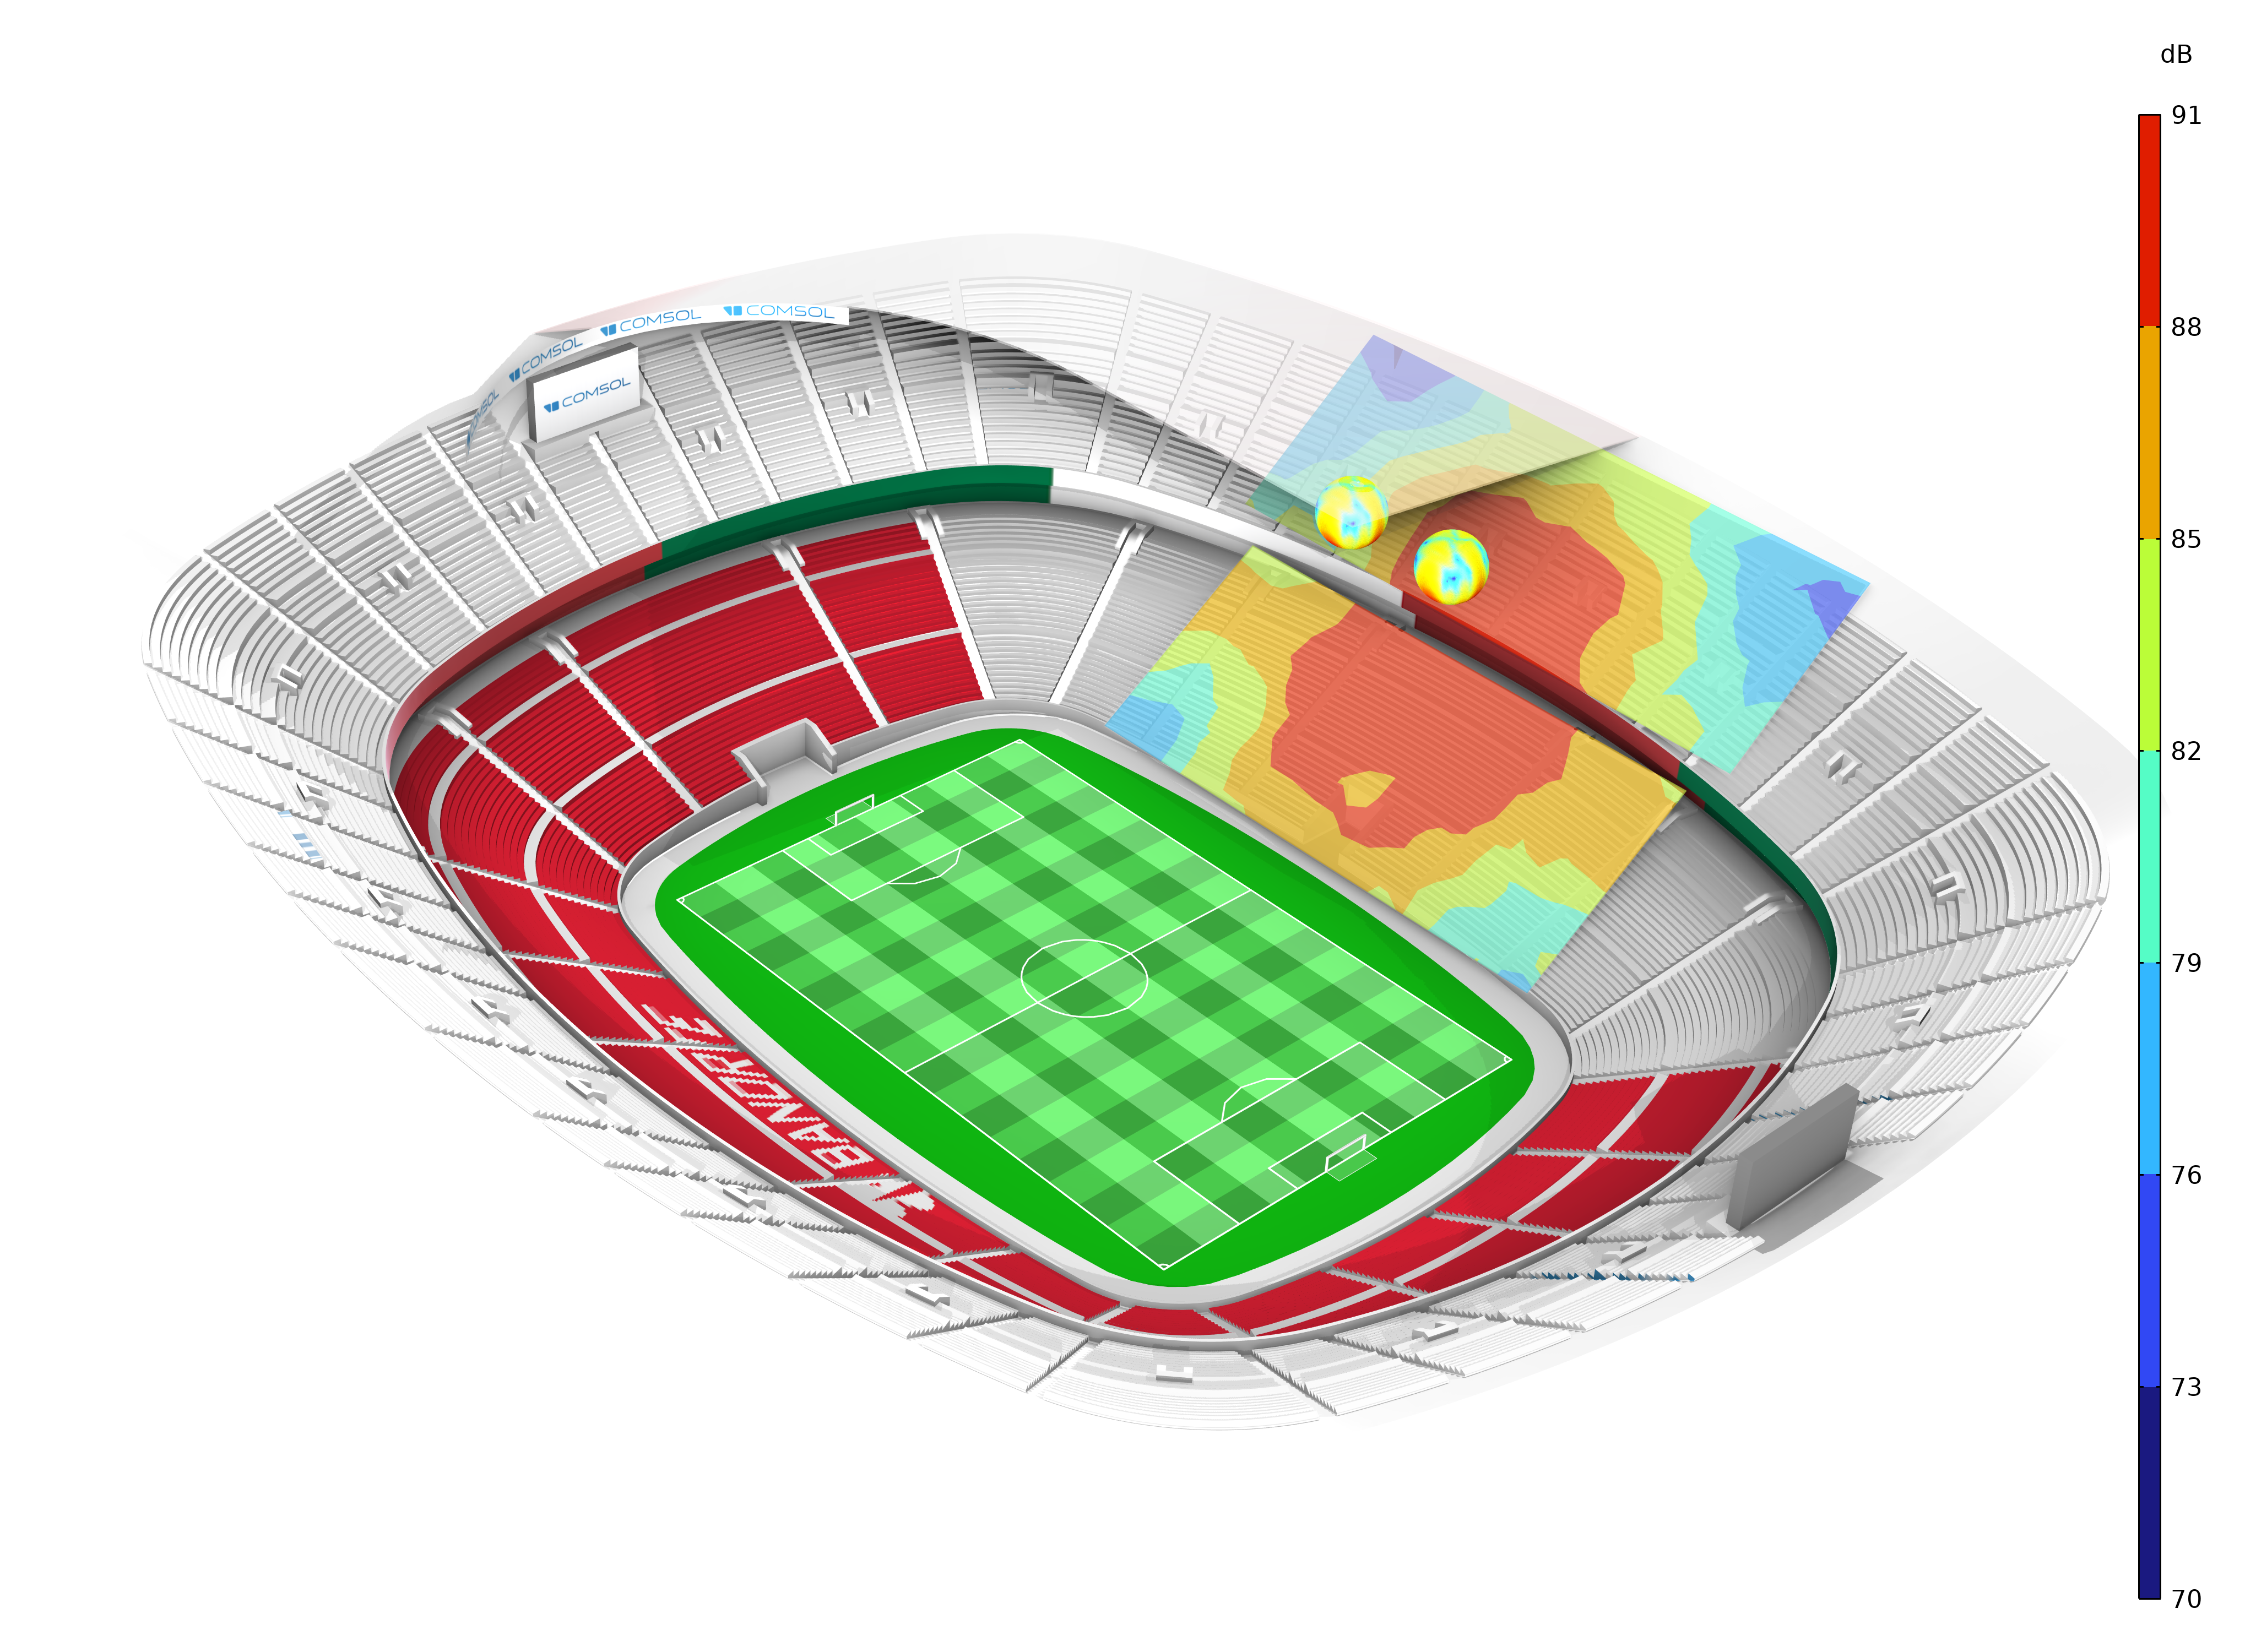
Figure 8. Sound pressure level map just above parts of the seating area below the locations of two speakers.
The impulse response, reverberation time, and speech transmission index could also be computed using this model. And to estimate the full acoustic coverage in Estadio Azteca, we could place all of the loudspeaker clusters throughout the model.
The Sound of the Beautiful Game
Several different types of models are needed to design the sound system of a stadium. In our case, we used a pressure acoustics model in the time domain for diffraction effects and the low frequencies, a BEM model to characterize the sound radiation from the loudspeaker cluster at higher frequencies, and a ray acoustics model to estimate the resulting sound pressure levels at higher frequencies. Together, these models can provide an accurate picture of the quality of the sound from the PA system.
One aspect of stadium acoustics that we didn’t consider? The roar of the crowd. That is the real sound of the giant.
More than 80,000 people experienced this thunderous wall of sound during the opening match between Mexico and South Africa. Some of them may have felt the same rush that Andrés Calamaro sings about in “Estadio Azteca”, where he describes the stadium as a giant that has “crushed” him. This feeling is not fear but awe. Anyone who grew up loving football recognizes that feeling when entering a huge stadium for the first time. In my case, it was walking into Estadio Centenario in Montevideo holding my father’s hand.
The sound of the crowd may very well be the subject of my next blog post.
For the Love of the Game (Only!)
Although the simulations presented here are based on established acoustics modeling techniques, they were created primarily for fun. A professional acoustics study of Estadio Azteca would require significantly more detailed information about the stadium geometry, loudspeaker system, materials, crowd distribution, and operating conditions than is publicly available.
The loudspeaker system used in the simulations was reconstructed from publicly available photographs and information from media reports and social media. We therefore make no claim that the model accurately represents the actual sound system installed in Estadio Azteca for the 2026 FIFA World Cup.
These investigations were performed independently of FIFA, Estadio Azteca, and d&b audiotechnik, and we do not claim any cooperation with these organizations.
Reference
- A. Peretokin et al., “Acoustics Features of Sports Facilities on the Example of FIFA 2018 Football Stadiums in Russia,” Proc. 23rd Int’l Cong. Acoust., Integ. 4th EAA Euroregio (ICA 2019), pp. 811–818, 2019.
Adidas and Trionda are registered trademarks of adidas AG.
ChatGPT is a trademark of OpenAI OpCo, LLC.
D&B Audiotechnik is a registered trademark of D&B Audiotechnik GmbH & Co. KG
FIFA and FIFA World Cup are registered trademarks of the Fédération Internationale de Football Association.
NVIDIA is a registered trademark and NVIDIA RTX is a trademark of NVIDIA Corporation
COMSOL AB and its subsidiaries and products are not affiliated with, endorsed, by, sponsored by, or supported by any of the foregoing trademark owners.


Comments (0)