
The Adidas® Telstar® soccer ball is the official ball of the 2018 FIFA World Cup™, and the Nike® Ordem V soccer ball is used in the seven largest national leagues in Europe, including the top three: the Spanish La Liga, the English Premier League, and the Italian Serie A. Previously, we discussed an experimental setup for measuring the terminal velocity of these two soccer balls to see if there’s a difference that could affect player performance. Here’s what we found…
Setting Up the Soccer Ball Experiment
We have already concluded that the position of a soccer ball suspended above the tube of a leaf blower should be inversely proportional to the terminal velocity. Therefore, a higher ball position corresponds to a lower terminal velocity, and a lower terminal velocity means a higher drag coefficient (Cd). We estimated that a difference between a Cd value of 0.2 and 0.15 should give at least a 15% difference in the position of the ball above the leaf blower tube. We concluded that we would be able to measure such a difference!
So, on we went. Our Video team in Boston built the test rig under very strict instructions from me. I even made them wear white lab coats, shave, and cut their hair — all for the sake of getting into the right mode for the measurements. The “high-tech” rig is shown in the figure below.
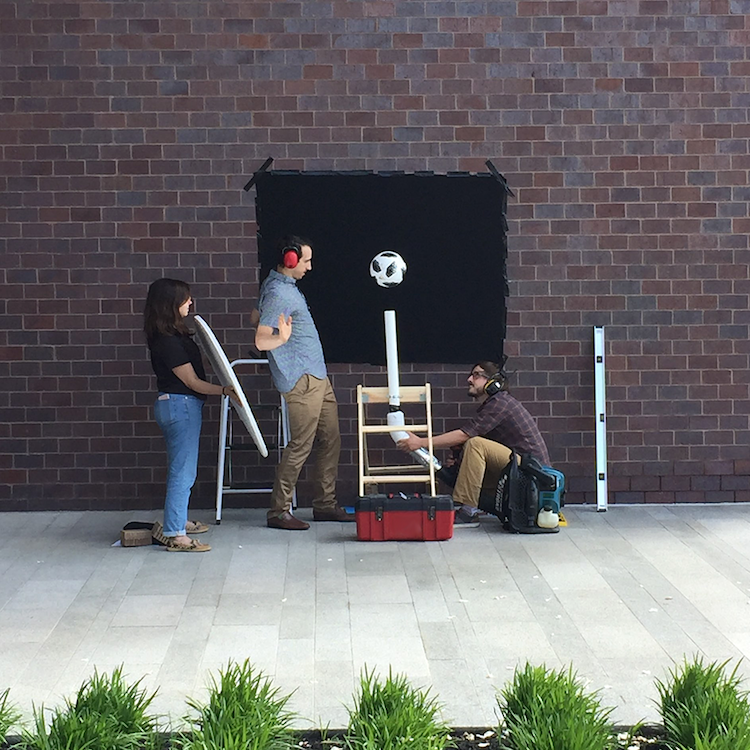
The high-tech rig set up by the Video team in Boston during the proof of concept. Unfortunately, none of them wore lab coats, nor did they shave! Maybe they were also standing a little bit too close to the wall. The pipe was corrected later, since it was a bit crooked.
Measuring the Distance from the Ball to the Tube
Alright, maybe it was not a high-tech test rig and maybe our team did not shave after all, but the measurements turned out pretty well. The videos below show the Adidas® Telstar® ball and the Nike® Ordem V ball suspended by the airflow from the leaf blower. We can also see the calibrated ruler that measures the position of the ball.
We were able to sample about 110–150 points in each time series once the ball was hovering at a relatively stable point above the leaf blower tube. For trademark reasons, we removed the logos from the balls afterward. But both balls are the real, high-end balls from the two manufacturers. The Nike® Ordem V ball is the winter ball, but besides the color, it should be a regular Nike® Ordem V ball with the Nike® Aerowtrac ball grooves and microtextured casing.
The Adidas® Telstar® (top) and the Nike® Ordem V (bottom), levitated by the jet from a leaf blower.
During the preparations, we also measured the diameter and the mass of the two balls. The diameter was about the same for the two balls: 21.9 cm for the Adidas® Telstar® ball and 21.7 cm for the Nike® Ordem V ball (rounded to 22 cm for both balls). The mass was 430 g for the Adidas® Telstar® ball and 435 g for the Nike® Ordem V ball. This depends, of course, on the pressure of the two balls. We tried to pump them to get the same mass. The difference in mass was about 1.2%, which we considered to be acceptable.
The Results: Which Ball Is Best for FIFA World Cup™ Preparations?
What about the results? The figure below shows the position of the ball above the leaf blower tube for two of the measurement series. The two balls hover around similar values. If there was a difference in the drag coefficient of around 0.05 (0.2 compared to 0.15), we should be able to see a difference of almost 2 cm in the average position of the two balls.
The amplitude of the movement is about 1.6–1.7 cm, while the average value is about 13.5 cm for the Adidas® Telstar® ball and 13.7 for the Nike® Ordem V ball. However, as we can see from the plots, this difference is substantially smaller than the amplitude of the hovering. The difference is not significant. In none of the measurements did we get a difference in position that came close to the 2 cm that we estimated from our calculations, if there was a large difference in the two balls’ Cd values.
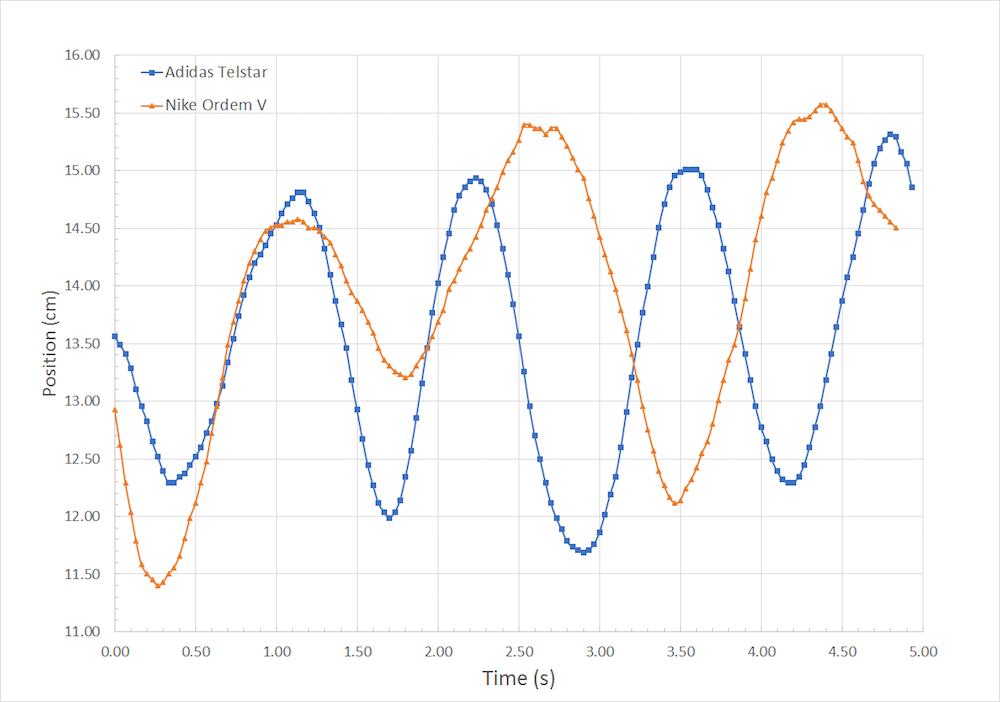
The position above the tube for the Adidas® Telstar® ball (blue squares) and the Nike® Ordem V ball (orange triangles).
One interesting detail is that the frequency in the hovering between the two balls is slightly different. The Nike® Ordem V ball shows on a slightly lower frequency, although the difference is small: 0.78 Hz for the Adidas® Telstar® ball and 0.62 Hz for the Nike® Ordem V ball. This behavior is seen in all of the measurements: the Adidas® Telstar® ball frequency varies between 0.74 and 0.78 Hz, while the Nike® Ordem V ball varies between 0.62 and 0.68 Hz.
What could be the cause of this sinusoidal behavior? Could it be the leaf blower? If that was the case, then the frequency would be the same for both balls. The difference is small, so we cannot completely rule out that the leaf blower gives these fluctuations. However, it could be the frequency in the separation of the larger-scale eddies behind the balls. The vortex and the wakes behind the ball cause it to move sideways and up and down when the ball does not have a spin; an effect called the knuckle ball effect or beach ball effect. The frequency is certainly within that range.
So, with our experiment, we have possibly detected a difference between the two balls. A higher frequency should mean a smaller wake behind the ball, which would also imply smaller eddies. The smaller wake may be caused by an earlier onset of turbulence on the surface of the ball facing the wind.
What Caused the Difference?
The figure below shows the panels of the Adidas® Telstar® ball separated by the welded seams. The total length of the seams is about 4.30 m, which is a high value compared to 3.22 m for the Adidas® Brazuca® ball and 3.53 m for a regular 32-panel ball. The seams are about 1.5 mm in depth, which is about the same as the Adidas® Brazuca® ball and deeper than a stitched ball.
A representation of the Adidas® Telstar® ball panels drawn in the COMSOL Multiphysics® software in order to measure the total length of the seams.
The Nike® Ordem V also has a higher total seam length compared to a regular 32-panel ball. In this case, we have grooves that are probably supposed to emulate seams, which divide each larger pentagon into smaller units. This results in 12 regular pentagonal faces and 20 hexagonal faces, where each of the 20 hexagonal faces is divided by a fuse-welded seam along the middle. This gives an estimated emulated seam length of about 4.14 m for the Aerowtrac grooves and around 2.37 for the fuse-welded seams for a total of 6.51 m! The seams are somewhat narrower than the grooves. The depth of the grooves is about 1.5 mm while the fuse-welded seams are 1.2 mm in depth.
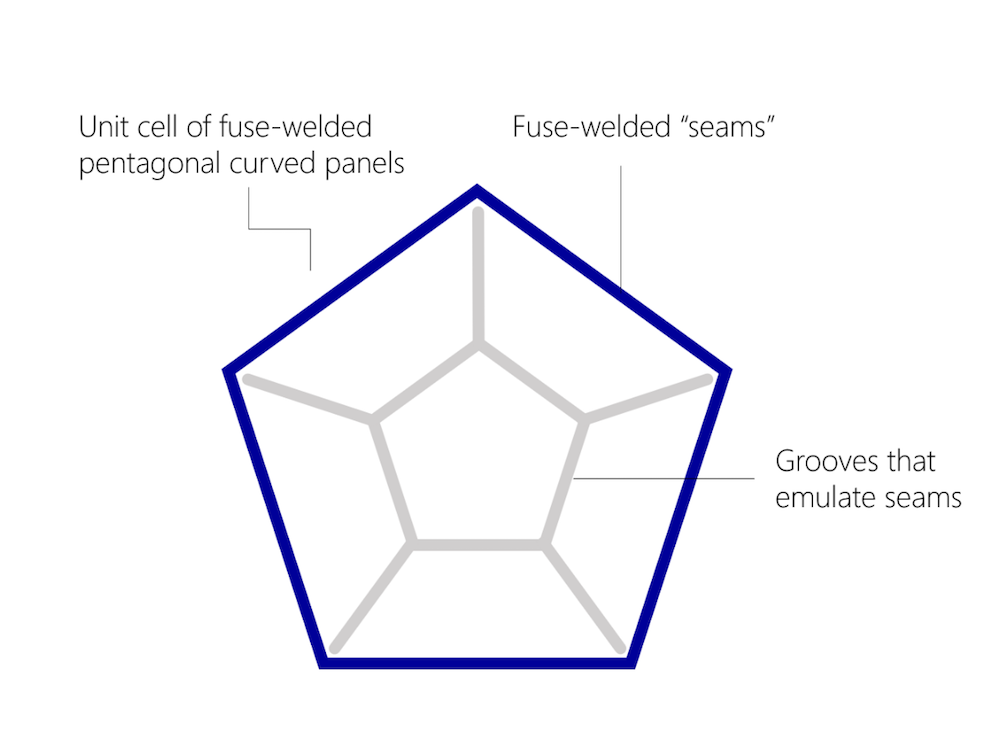
A representation of the unit cell of the Nike® Ordem V ball. The ball consists of 12 fuse-welded pentagonal but curved unit cells (blue edges) and panels with smaller pentagonal grooves and lines (gray).
There are twelve panels in the Nike® Ordem V ball. The representation shown here is divided into three different colors. Inside each panel are the Nike® Aerowtrac grooves.
Both balls have substantially longer “seams” (or grooves that emulate seams) compared to the regular 32-panel ball. The length and depth of the wider grooves of the Nike® Ordem V ball are comparable to the depth and total seam length of the Adidas® Telstar® ball. What does this mean? The larger total length of the seams and the grooves of the Nike® Ordem V ball should result in a slightly higher drag coefficient. This could be the case, but the difference would be relatively small compared to the Adidas® Telstar® ball, considering that we did not see any differences at all in the levitation height.


Seam of the Adidas® Telstar® ball (left) and the Nike® Ordem V ball (right).
The longer seam may imply that the turbulent boundary layer is stable at lower velocities for the Nike® Ordem V ball compared to the Adidas® Telstar® ball. So, the two balls may have a different speed at the drag crisis, where the boundary layer changes from turbulent to laminar, with a higher speed for the Adidas® Telstar® ball. However, this difference is probably small, considering both the structure of the surface of the balls and the very high values of the seam lengths (compared to previous balls, such as the Adidas® Brazuca® ball and Jabulani® ball). The Adidas® Telstar® ball has rectangular imprints similar to a plain weave structure while the Nike® Ordem V ball has very discreet circular projections and stripes running in parallel to the fuse-welded seams. The more pronounced surface structure of the Adidas® Telstar® ball should lower the speed at the drag crisis and even out the difference in seam and groove length between the balls.


Surface structure of the Adidas® Telstar® ball (left) and the Nike® Ordem V ball (right). The picture was taken during the pumping procedure.
The Adidas® Telstar® ball and the Nike® Ordem V ball probably behave similarly in the air, both for the speed when given a certain impulse (a kick), the onset of the spin when the ball is given a spin (the Magnus effect), and the speed for the onset of the knuckle-ball effect (beach-ball effect) when the ball is kicked with no spin at all. Maybe the Adidas® Telstar® ball could have a slightly higher speed when the Magnus effect sets in (when the ball curves) and a slightly higher speed when the beach-ball effect sets in (when the ball starts moving sideways and up and down).
Comparable Balls = No Controversies
What about the errors in our measurements? Like I mentioned in the previous blog post in this series, we have no wind tunnel and this is the first time we ran such an experiment. We had very little time and limited resources. If we had the time to redo the experiments, we would have used at least four leaf blowers connected to the same pipe. This would have given a higher elevation point for the two balls and made it possible to measure smaller differences in the Cd value at the terminal velocity. The fact that the ball hovers so close to the leaf blower tube could have also caused very large separation zones behind the ball, although this does not seem to have disturbed our experiments.
We could also have introduced a pitot tube to measure the flow rate and a highly porous honeycomb structure at the bottom entrance of the last straight tube in order to make sure that the flow was even and free from larger eddies at the outlet of the tube.
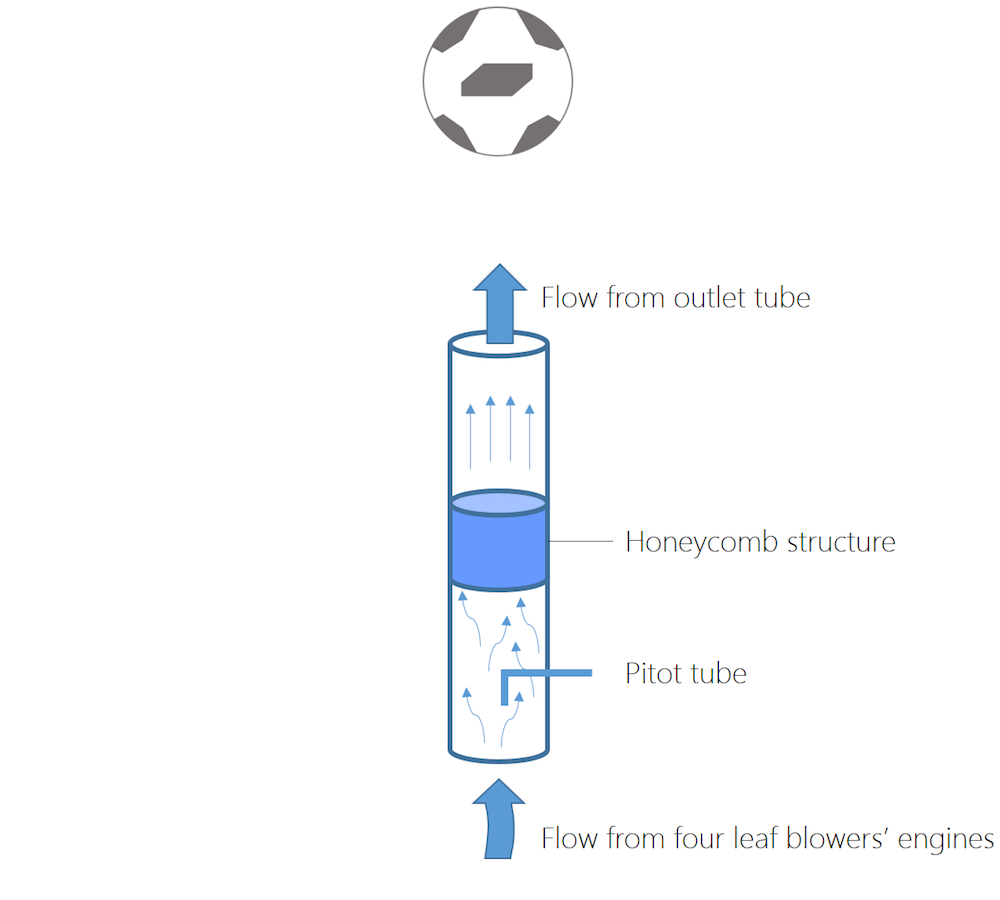
Plans for a future experiment with a more controlled and powerful flow.
Perhaps this experimental setup is for the next FIFA World Cup™. For 2018, we are fairly convinced that the ball will not present any controversies. Our measurements show a slight difference in the hovering frequency between the Adidas® Telstar® ball and the Nike® Ordem V ball: They are close, but not identical.
Still, none of the teams seem to be taking any chances. All teams, including those sponsored by Nike, have been seen practicing and playing with the Adidas® Telstar® ball to better prepare for the FIFA World Cup™. Me? I prefer the Adidas® Jabulani® ball. The extremely low drag coefficient and high speed at the onset of the Magnus and beach ball effects facilitate spectacular free kicks and long range shots! But then again, I have never been a goalkeeper…
Further Reading
- Read Part 1 of this blog series for a closer look at the theory and setup behind the soccer ball experiment:
- Browse more blog posts about the physics of sports:
Adidas and Brazuca are registered trademarks of adidas AG. Telstar and Jabulani are registered trademarks of adidas International Marketing B.V. COMSOL AB and its subsidiaries and products are not affiliated with, endorsed by, sponsored by, or supported by adidas AG or adidas International Marketing B.V.
Nike is a registered trademark of Nike, Inc. COMSOL AB and its subsidiaries and products are not affiliated with, endorsed by, sponsored by, or supported by Nike, Inc.
FIFA World Cup and 2018 FIFA World Cup are trademarks of FIFA. COMSOL AB and its subsidiaries and products are not affiliated with, endorsed by, sponsored by, or supported by FIFA.

Comments (3)
Jean-Marc Petit
June 7, 2018 COMSOL EmployeeWhat about the beginnig of your position data ? Looks quite different from the following, especially for the Nike one (perhaps due to a different initial position ?). If you remove this beginning part, looks like Nike position is higher by almost 1cm I would say (just looking at the figure). It looks like also that the position is slightly increasing after each oscillation : you probably didn’t reach the stable average position ? More over did you repeat the experiment ?
Ed Fontes
June 7, 2018 COMSOL EmployeeHi Jean-Marc,
We repeated the measurement. There is not significant difference in position between the two balls. The graphs show the same tendency with the sinusoidal fluctuations but the averages are about the same for the two balls. The initial position is just where the ball happens to be when the recording is started.
Ed
keyvan hassanpor
April 9, 2022Great Post . Could you please send us Telstar ball simulation file or tutorial ?