
What’s gold, shiny, and resides in hundreds of celebrity homes? The answer is the iconic OSCARS® statuette — the most recognized award show trophy in the world. Their famous golden appearance is achieved through electroplating (Ref. 1). These awards are electroplated individually, but when multiple components need to be electroplated simultaneously, they are typically mounted on a rack and put into an electroplating bath in a process called rack plating. Let’s discuss how simulation can help optimize the rack plating process for multiple components.
Electroplating 101
Electroplating, or electrodeposition, is the process of coating a thin layer of metal onto another metal object. It’s known for making inexpensive metals look expensive, but it can also help prevent corrosion and rusting and augment undersized parts, among other benefits.
Fun fact: Modern tin cans are actually made of 98.5% steel, but are electroplated with a thin tin coat.

Common electroplated items include kitchen utensils, car parts, and everyday accessories.
Italian chemist Luigi V. Brugnatelli invented electroplating in 1805. He used a steel wire to connect a Voltaic pile, the first electrical battery, to a solution of gold and a metal object. When the Voltaic pile was activated, it released a current, which resulted in gold attaching to the metal object, giving it a lustrous finish. In the Belgian Journal of Physics and Chemistry, Brugnatelli wrote:
“I have lately gilt in a complete manner two large silver medals, by bringing them into communication by means of a steel wire, with a negative pole of a voltaic pile, and keeping them one after the other immersed in ammoniuret of gold newly made and well saturated.”
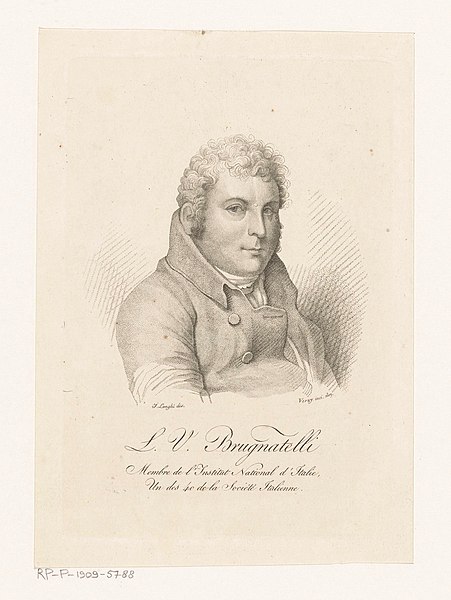
Portrait of Luigi V. Brugnatelli. Image by Rijksmuseum — Own work. Licensed under CC 1.0, via Wikimedia Commons.
During the electroplating process, a positively charged electrode (aka an anode) and a negatively charged electrode (aka a cathode) are placed into an electrolyte bath. Both electrodes are connected to a power source, like a battery. When activated, the power source applies a voltage between the electrodes, which eventually results in the anode dissolving into the electrolyte bath and the cathode getting plated with the desired metal finish.
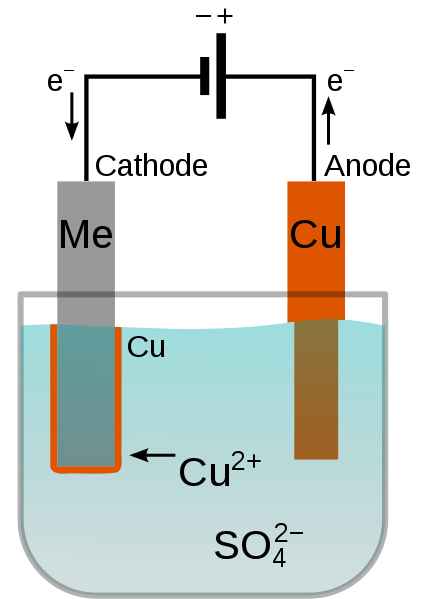
Electroplating of a metal (Me) with copper in a copper sulfate bath. Image in the public domain, via Wikimedia Commons.
In a previous blog post, we discussed at length how the electroplating process works, using the example of how the U.S. Mint electroplates pennies with copper. In this post, we’ll focus on how simulation can be used to efficiently electroplate multiple components in a rack.
Modeling the Electroplating of Multiple Components in a Rack
Rack plating is a popular method when electroplating intricate, complex, or large metal objects. When compared to barrel plating, rack plating is considered the preferred choice in industries where a high-quality finish is paramount, such as automotive, medical, military, and electronics manufacturing. Rack plating is also much faster than electroplating items one at a time.
When rack plating, it’s challenging but imperative that all of the substrates, or items getting plated, get coated in a uniform metal layer. The Electrodeposition Module combined with numerical modeling make it possible to investigate the effect of geometrical and operational parameters on electroplating uniformity, which helps optimize this electroplating process.
Model Geometry
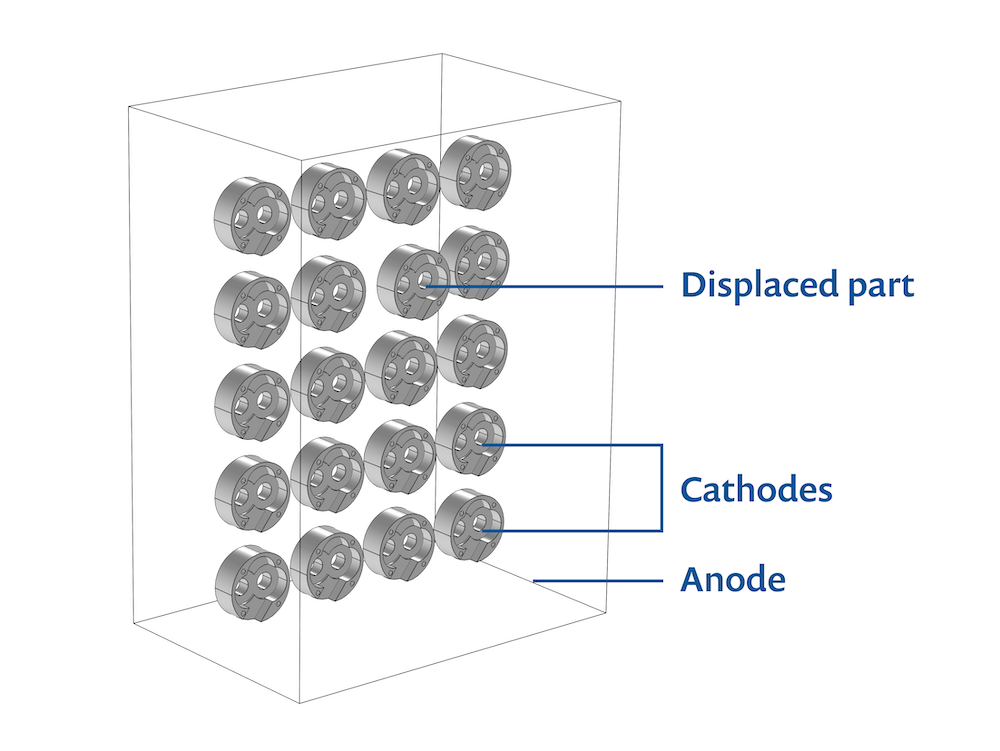
In this model, 20 oil pump covers are mounted in a rack (Ref. 2). The covers are all electroplated with nickel. Nickel plating is popular because it offers superior chemical and corrosion resistance along with greater wear resistance, which increases product life cycles.
The anode is a planar dissolving anode, and the cathode is the array of oil pumps covers.
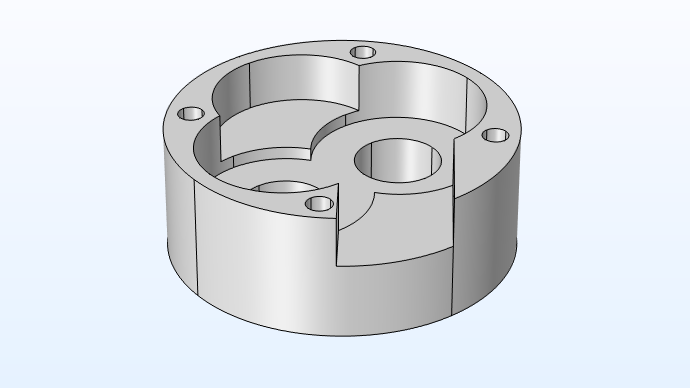
The model geometry is parameterized, which allows the oil pump covers to be displaced toward or away from the anode surface. As shown in the image below, one oil pump is displaced toward the anode in order to demonstrate the geometrical effect on the current distribution in the electrolyte bath.
Below, you can see the close-up geometry of an individual oil pump cover.
In this model, which uses a secondary current distribution interface, you apply the Butler–Volmer kinetics to the anode as well as the cathode in order to compute the deposited layer’s thickness at the cathode surface.
Analyzing the Results
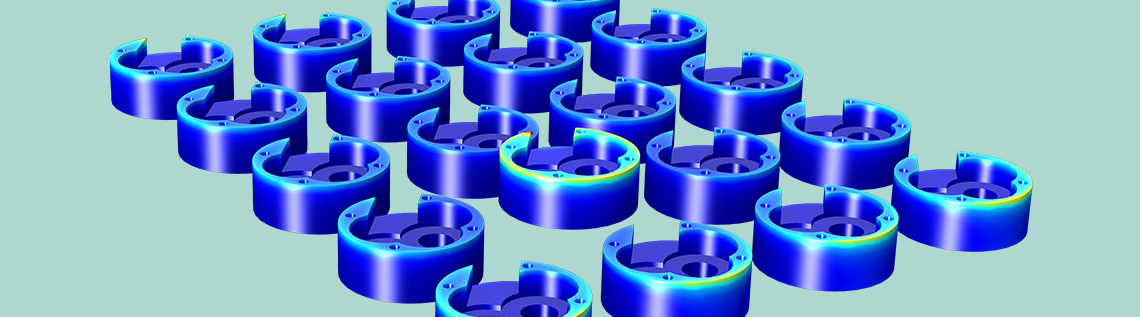
Below, you can see both a streamline and surface plot of the electrolyte current density at the oil pump cover, or cathode, surfaces. In the electrolyte, the current flows from the anode surface to the cathode surface. The surface plot of the total current density shows a nonuniform density distribution across the shape of the oil pump covers (and between them). The current density is highest at the displaced oil pump cover, located closer to the anode. The oil pump covers along the edge of the rack receive a higher current than those at the center of the rack.
The inconsistent current distribution is due to the:
- Complex shape of the oil pump covers
- Mounted position of the oil pump covers on the rack
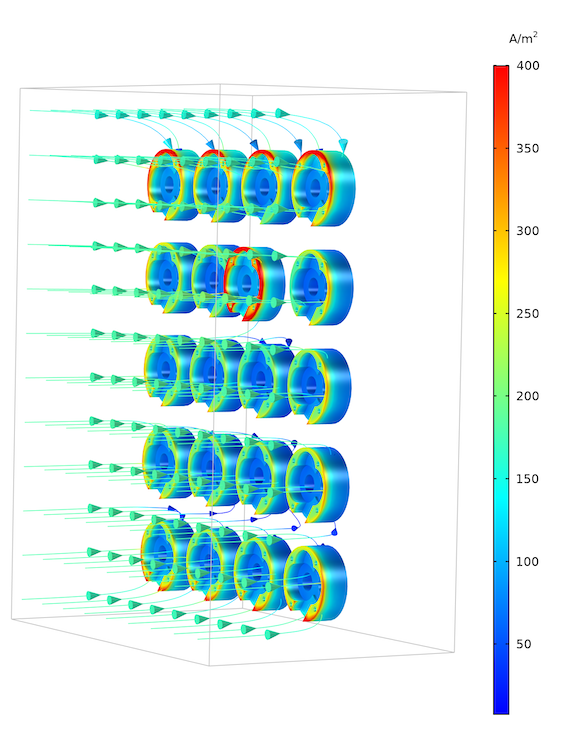
Current density distribution in the rack. The plot shows the high current density on the protruding cathode and also the edge effects on the components placed on the edge of the rack. These components get a slightly higher current density, since there is space on the side for some of the current to have a longer path.
Next, let’s look at the electroplating thickness over the cathode surfaces, which is directly related to the aforementioned current density distribution plot. Below, you can see the lowest deposition thickness is found at the bottom surface of the cathodes, and the highest deposition thickness is found at the top of the surface of the displaced cathode.
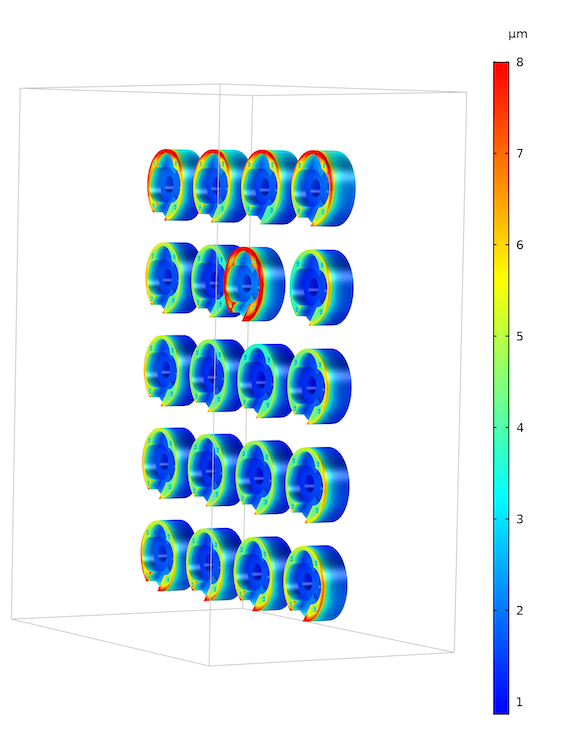
Electroplating thickness at the cathode. The nonuniform current density distribution in the previous plot is also revealed in the deposition thickness. The cathode with the highest current density obviously also gets the thickest deposit. Also, the edge effects on the components placed on the edge of the rack result in a thicker plating.
Numerical models, like this one, are useful in optimizing the deposition process because they allow engineers to change design and operation parameters, such as:
- Plating rack configuration
- Plate cell geometry
- Distance between the anode and cathode surface
- Conductivity of the electrolyte
- Applied current
- Applied potential
Next Steps
Try modeling the electroplating of multiple components in a rack by clicking the button below. Doing so will take you to the Application Gallery.
Further Reading
Learn more about electroplating on the COMSOL Blog:
- The Art and Science of Electrochemical Plating
- Electroplating Simulations for Printed Circuit Board Designers
References
- C. Bell, “What You Probably Never Realized About Award Show Trophies“, Reader’s Digest, 2019.
- J. Deconinck, G. Floridor, B. Van den Bossche, L. Bortels and G. Nelissen, “Numerical 3D BEM Simulation of the Chromium Layer Thickness Distribution on Parts in a Rack Plating Configuration”, Simulation of Electrochemical Processes, vol. 48, p. 173, 2005.
Oscars is a registered trademark of Academy of Motion Picture Arts and Sciences Corporation.


Comments (2)
Lautaro Gambino
June 29, 2020Hi,
I’m attempting to simulate deposition of nickel in nanocavities with a 3 electrode system, where the nickel ions comes form the electrolyte solution and make a cyclic voltammogram(CV) and chronoamperometry study. I’ve been using this app model and some others to get started with COMSOL, but i haven’t been successful in modeling a electrodeposition reaction where the source of ions comes from the electrolyte solution.
By any chance could you give me some guidance or know someone who can guide me in the electrodeposition module?
Thank you in advance,
Sincerly, Lautaro Gambino
NGUYEN KIM THANH PHONG
October 10, 2022Hi, thanks for sharing this awesome post.