
There has recently been a lot of controversy online regarding an entertaining video that tries to address a big misconception about electricity: that electrons carry the energy in an electrical circuit. Although the video, and many of the response videos, are certainly engaging, there is so much more to the story, and using the COMSOL Multiphysics® software is an excellent way to investigate this theory. Let’s learn more!
The Background of the Controversy
The video that started it all is “The Big Misconception About Electricity“. It presents a circuit diagram similar to the figure shown below. An ideal battery is connected via an ideal switch to form an ideal source. This source is connected to a pair of zero-resistance wires — each 300,000 kilometers in length and stretching in opposite directions — that loop back to a light bulb placed 1 meter away. Although not explicitly stated, it is assumed that the entire circuit is sitting in some kind of empty universe, free of cosmic background radiation, which would easily be detected by this device.

Figure of the controversial circuit.
The question is: If you close the switch, how long will it take for a signal to propagate from the source to the bulb? The answer of 3.33 nanoseconds (ns) is correct (Gap/c \approx 3.33\text{ ns} where c is the speed of light). There are a number of videos that provide different ways of understanding this brainteaser:
- “Energy Doesn’t Flow Inside Wires – Is Veritasium Right – RSD Academy“
- “Electric Energy Doesn’t Flow in Wires – Follow-up No. 2 – RSD Academy“
- “I bought 1000 meters of wire to settle a physics debate“
It was, however, also pointed out that we should define a threshold current, and ask at what magnitude of current the bulb will turn on. That is the kind of practical problem that COMSOL Multiphysics is great at addressing, so let’s jump right into it!
Building a Numerical Model and Understanding the Results
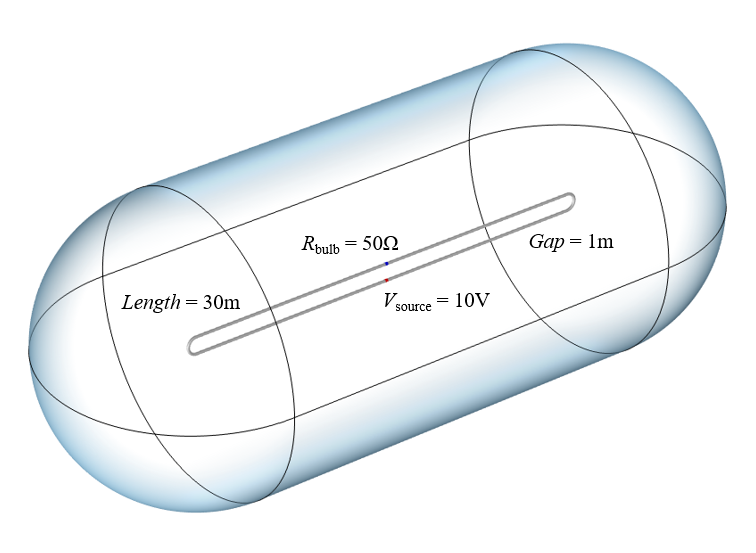
An illustration of our computational model. Wire radius is 0.1 meter and radius of computational domain is 10 meters.
Since we are going to be solving for the electromagnetic fields in the space around the wires, building a computational model that is 300,000 kilometers long may be impractical, but we can learn a lot with the smaller model shown above. To model the source, we use the Lumped Port feature, which applies a uniform potential starting at time zero. The bulb is modeled as a Lumped Element, which adds a resistance across the gap between the other end of the wires. The two 30-meter-long wires are modeled via Perfect Electric Conductor boundary conditions. Assuming that the wires are perfect conductors is reasonable, as such superconducting wires are already being made. The volume of space around the wires is treated as a perfect vacuum, and the boundaries of that volume are treated as open to free space. Once we’ve built this computational model, we can solve and visualize the fields and the currents on the wires.
Results showing the electromagnetic energy density as semitransparent isosurfaces and the current along the wire. Part of the signal propagates outward at the speed of light, inducing currents on the wires across the gap. The fields are also guided by the wires, and there are radiation losses. Over longer time, the behavior is dominated by the inductance and resistance of the system.
The animation above shows the electromagnetic energy density in and around our circuit over time. We can observe the initial signal propagate outward at the speed of light, and once the time-varying fields reach the wires next to the bulb they will start to induce a current through the bulb. The fields are primarily guided by the wires, although there is some radiation away, especially when the fields get reflected at the bends. After the first few hundred nanoseconds, the fields start to become more uniform at any instant in time. We can also plot the current through the bulb over time and discuss what its shape tells us about our system.
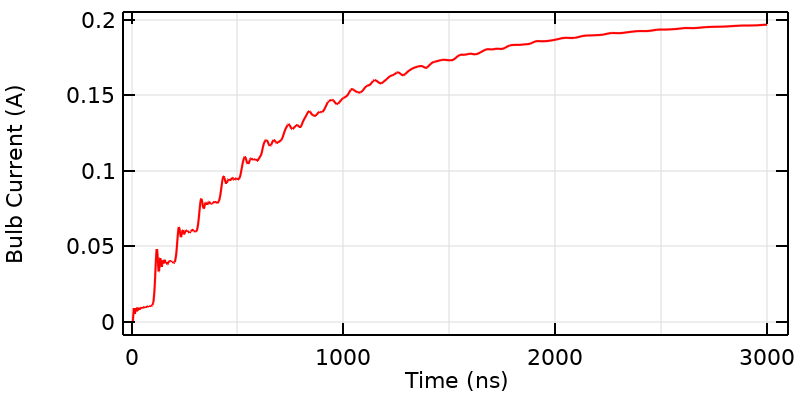
The bulb current over a longer period of time than it normally takes for the signal to propagate across the gap; it resembles the response of an RL circuit.
The Overall Shape
If we look at the overall shape of the curve, it looks like the bulb current is rising toward the steady-state current. That is because what we have here is really an RL circuit, and we can describe the overall shape of the curve (after 3.33 ns) with the equation: I\left( t \right) = I_{DC}\left( 1 – exp(-t/\tau_{RL})\right) where the RL time constant is \tau_{RL} = L_{wires}/R_{bulb} and the inductance, L_{wires}, can be computed from a steady-state model. The total inductance is directly proportional to the length of the wires, so a longer loop will have slower rise time.
If we define the threshold current when the bulb turns on as being I_{DC}=V_{battery}/R_{bulb}, then (from a strictly mathematical point of view) the current will only get infinitesimally close to I_{DC}, and the bulb will actually never turn on. Well, in reality, the bulb will eventually turn on since what it actually measures is the velocity and acceleration of a discrete number of moving charges. But still, a threshold current very close to the DC current will mean that the bulb won’t turn on until a time much greater than the RL time constant.
The Distinct Plateaus
If we look more closely at the curve near the start time, we see that there are several distinct plateaus to the signal, leading to a kind of stair-step shape. The characteristic time of each of these plateaus is 100 ns because the applied step-signal travels along the entire wire, and experiences some reflection at the bends exactly at the midpoint of each wire. The height of these steps is related to the capacitive and inductive coupling across the gap.
In fact, it is possible to characterize this stair-step behavior with a circuit model of a transmission line. Note that these plateaus smooth out over time, and that we’ll soon address where this smoothing comes from. For now, let’s remark on the second possibility: that depending on what threshold current we specify, the bulb might turn on at an integer multiple of 100 ns.
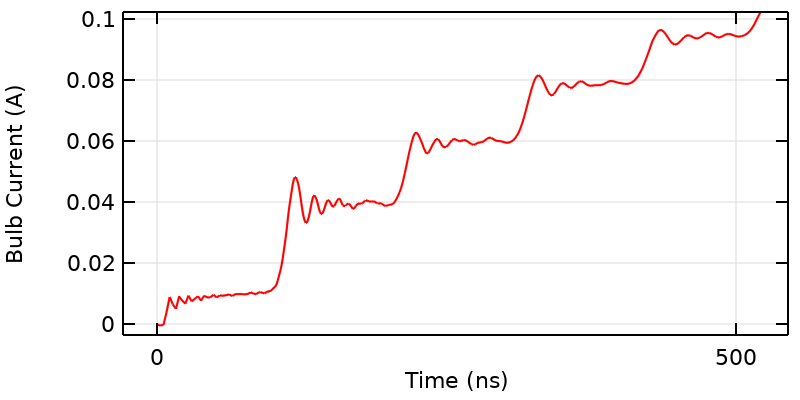
Near the initial time, the current over time also exhibits distinct plateaus with the period equal to the time it takes the signal to propagate along the entire wire length. In addition, there are oscillations that arise due to the step change from the idealized switch, and the resonant behavior of the system. These decay over time due to the losses in the system.
The Fast Ripples and Their Decay
If we take an even closer look at the start of each step, we see that there are distinct ripples in the current with higher peaks at the beginning of each step that gradually die out. This means that if we choose the right threshold current, the bulb will first flicker and then turn on, giving us a third possibility!
These ripples are due to the spatially distributed capacitance and inductance of the system, which will lead to not just one, but an infinite number of resonances. We are observing the higher-order resonant modes of the system getting excited by the source. But, note that these ripples seem to decay. This decay and smoothing out of the signal are due to losses. One source of loss is resistance from the known bulb, which converts energy stored in the battery into heat and light. The second source of loss is due to radiation of energy away from other parts of our circuit. Correctly predicting this loss requires the type of three-dimensional model that we are building here.
The higher-frequency, short-wavelength content will radiate away quicker than the low-frequency content. Another way of saying this is that higher resonances have lower quality factor, or that the wires are a kind of lossy low-pass filter.
We should also ask how this high-frequency content that excites these resonances is being introduced into the model. Recall that when we close the switch, we introduce a step change in the applied electric potential. We have to ask ourselves what frequency content this step change has. This question is answered by taking the Fourier transform. As it turns out, we have infinite frequency content in our input signal. The very high-frequency content has small magnitude, and quickly radiates away, but it is realistic. It is also worth noting that this frequency content tells us something about the circuit and its design. If we were to change the shape of the bend in the middle of the wires, we would get different reflected signals.
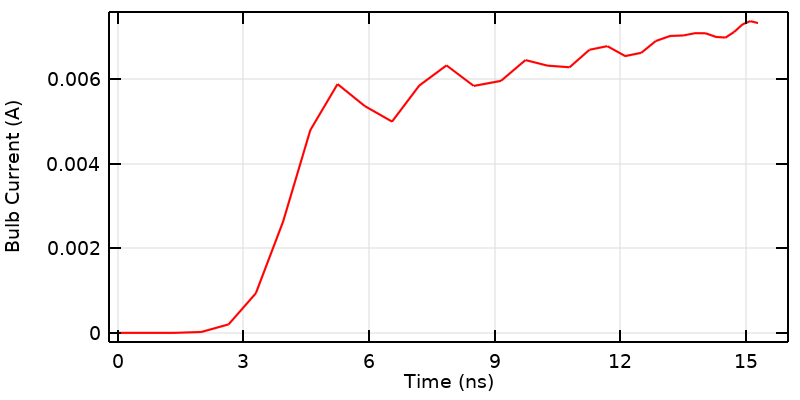
Looking at the results close to the start time, the numerical method adds some small artificial dispersion into the model as a consequence of our idealized switch. This could be addressed by instead adding realistic ramping to the input signal.
The Solution Near the Start Time
There is one last section of this curve that deserves some special attention. At the very beginning of the simulation, we see that the signal is initially zero, but becomes nonzero before 3.33 ns. This is a small numerical artifact that arises because we are modeling a nonphysical situation: a switch that turns on instantaneously. Such a switch is physically impossible: Even the fastest known physical processes have rise times on the order of an attosecond. If we were concerned with this part of the results, we would replace our step change with a transient signal that has some realistic rise time. We would also have to solve our numerical model with a fine timestep and a fine spatial discretization (which could take a long time) to get the curve to be smoother.
One other way of thinking about this last point is that the underlying numerical methods are adding back in the dispersion that we forgot to include. This is an expert-level point for the dedicated numerical analyst, and we can safely say that in reality, information does not travel faster than the speed of light.
What’s the Final Take on the Controversy?
In short, there is no controversy. The correct takeaway from the original video is that, for the circuit under consideration, it will take 3.33 ns for a signal to propagate from the source to the bulb.
A more complete take is to say that the response curve exhibits:
- A delay, which is a consequence of the time it takes for the electromagnetic fields to propagate through the space between the source and the bulb after which some current will be induced.
- An RL-circuit response, since this is essentially a very large inductive loop of wire in series with a resistor.
- Stepped plateaus that arise as a consequence of the signal reflection at the sharp bend at the wire midpoints. The height of these steps is governed by the inductive and capacitive coupling between the nearby parallel wires.
- Fast ripples that arise as a consequence of the step change in the input signal, exciting the resonances of the structure.
- Decay of high-frequency content due to both the resistance of the bulb, as well as radiation.
Building such a model to verify this behavior is fast and easy to do in COMSOL Multiphysics. Here are some other possible changes that we could investigate:
- Altering the radius of the wires. This would change the magnitude of the capacitive coupling, and thus alter the height of the steps as well as the period of the ripples.
- Considering wires with finite conductivity. This would decrease the current at steady-state conditions, but would only have a quite small effect on the signal immediately after 3.33 ns. So, depending on the threshold, the bulb could turn on at 3.33 ns and then turn off some time later.
- Changing the orientation of the wires so that the two wires remain close together, and are no longer going in opposite directions. In this case, although there will still be some crosstalk, the wires will act much more like a transmission line.
How else might you alter this circuit to get different behavior? Leave your thoughts and comments below!
Addendum for COMSOL Multiphysics® Users
If you’d like to download the model used to generate the figures above and try out other situations, it is available via the link below. The model is built using the RF Module. In addition, we have a number of other resources that are useful for this type of modeling:
- To understand a few fundamental concepts about voltage and ground in the DC case, see “Do Voltage and Ground Exist?“
- To understand more about the transmission line interpretation of this system, read “Voltage and Ground When Modeling Wave-Like EM Fields“
- To understand the Lumped Port and Lumped Element excitation, see “Modeling TEM and Quasi-TEM Transmission Lines“
- To understand why the signal in this example appears to be nonzero before t = 3.33 ns, it is helpful to have an understanding of the finite element method, which discretizes the problem in space and time
- To understand how to more realistically model the switch, see this Knowledge Base entry
- To see a similar modeling technique applied on a more realistic device, check out our example model on time-domain reflectometry
- To understand how the skin effect due to finite conductivity comes into play, and how you would need to adjust your computational model to account for this, see “Modeling of Materials in Wave Electromagnetics Problems“
- To predict the behavior of a parallel wire transmission line, see this Application Gallery entry
- If you are uncomfortable with the assumption of an infinite universe free of noise, you could instead model this system placed inside of an anechoic chamber. Learn more about this model from this Application Gallery entry
- If you are wondering what the effect would be of having nonuniform radius wires in a transmission line, read “Computing the Impedance of a Corrugated Waveguide“
- If you’re wondering why our model includes such a large region of space around the wire, see “Using Perfectly Matched Layers and Scattering Boundary Conditions for Wave Electromagnetics Problems“
- If you’ve noticed that all of the fields in this model have symmetry about the center, and if you’re thinking that this could simplify the model, you would be correct. To learn more, read “Exploiting Symmetry to Simplify Magnetic Field Modeling“
- Finally, if you’re interested in one of my favorite brain-teasers in electromagnetics, see “Computing the Inductance of a Straight Wire“


Comments (6)
René Christensen
January 7, 2022Great analysis. Veritasium’s video seemed rushed with too little emphasis on transient vs steady-state behavior, but it did spark some interesting videos from other contributors, and perfect example to be analysed with COMSOL MP.
Walter Frei
January 7, 2022 COMSOL EmployeeThank you René, Yes, it is an example rich in complexity. There’s even so much more one could do in terms of modeling a realistic source and switch over the first few nanoseconds.
Matteo Pancaldi
January 13, 2022Dear Walter, thanks a lot for this post! It would be nice to also see how the propagation changes when the switch is placed as far as possible with respect to the bulb and the source, i.e. close to the wire bend 15 meters away.
Walter Frei
January 13, 2022 COMSOL EmployeeYes Matteo, I agree! In this case you would have much more of a transmission line with a load (extra impedance) localized along one conductor. The sample file (from the link above) can be modified to try out this situation as well. Happy Modeling!
Julian Anaya
February 11, 2022This is a great example of the complexity of modeling EM fields, congrats! Sometimes the simplest toy models are the best to really understand the complexity of the physics governing the problem, and this is a wonderful example. It is funny to see how a simple model like this one hides so many details, and then to realize that in the industry you get people asking you to simulate a very complex geometry into COMSOL and pretend to make sense of the colorful results we obtain there as if it is a trivial task…
Walter Frei
February 11, 2022 COMSOL EmployeeThank you Julian, This was a particularly fun example model, as the complex behavior can be explained in terms of elementary electrical engineering concepts, and yet people manage to construct some quite over-complicated arguments.
A good engineer always tries to make things as simple as possible, but no simpler!
Happy Modeling!